What is MACD Moving Average Convergence Divergence and how to use?

Moving Average Convergence Divergence (MACD) indicator can help you measure a stock's momentum and identify potential buy and sell signals. MACD very useful momentum indicator in cryptocurrency trading.
The Moving Average Convergence Divergence MACD indicator helps investors identify price trends.
What is Moving Average Convergence Divergence (MACD)?
MACD full form: Moving Average Convergence Divergence and is a trading indicator used in technical analysis of the currency , crypto and stocks. It is designed to reveal changes in the direction, duration, strength, and momentum of a trend in a stock’s price and currency pairs.
MACD is one of the most widely used momentum indicators in technical analysis.
By computing the distinction between two time period intervals, which are a compilation of historical time series, this indicator is used to define momentum and its directional resilience. MACD uses moving averages of two distinct time intervals (most commonly historical closing prices of securities), and a momentum oscillator line is calculated by deducting the two moving averages, which is also known as 'divergence.'
The fundamental criterion for choosing the two moving averages is that one should have a quicker period than the other. For this purpose, exponential moving averages (EMA) are commonly used.
How MACD works?
MACD charts typically include three components: the MACD line, the Signal line, and a histogram of the difference between the two. At its simplest: a bullish signal occurs when the MACD line crosses above the signal line, and a bearish signal occurs when the MACD line crosses below the signal line.
The value of the MACD line is calculated by subtracting the 26-period exponential moving average (EMA) from the 12-period EMA (although an analyst can use other averages, if desired, to optimize the indicator).
These are the default parameters when you put the MACD indicator on the charts, and the period is usually 9 which means the last 9 candles.
Once that calculation is complete the Signal line and a histogram of the difference of the two can be determined.
The Signal line is simply a moving average of the MACD line, typically a 9-period EMA, which “smoothes” out values of the MACD line, producing a “slower” dataset. (To optimize the Signal line, the 9-period EMA can also be changed.)
The last component of the MACD chart is the histogram, which is determined by subtracting the Signal line from the MACD line.
Thus, the calculations are as follows:
MACD = 12-period EMA - 26-period EMA
Signal = 9-period EMA of MACD
MACD histogram = MACD - Signal
How to read MACD?
It's crucial to comprehend the details of a MACD indicator on a graph before learning how to use it. Three key components make up the MACD indicator:
1. MACD Line - the fastest moving average (short-term EMA)
The MACD indicator is calculated with the subtraction of a short-term, 12-day EMA from a long-term, 26-day EMA. It is usually blue in color.
Line MACD = (12-day EMA minus 26-day EMA)
2. Signal Line - the slowest moving average (long-term EMA)
This is a 9-day line that is commonly painted in red to illustrate price activity turns. It is usually orange in color.
Signal Line = MACD Line's 9-day EMA
3. MACD Histogram - swings above and below a zero line, allowing bullish and bearish momentum readings to be distinguished.
The difference between the first two items is the histogram (MACD line minus signal line). The histogram is positive when MACD is above the signal line and vice versa.
In order to correctly read the signal, one should check the following:
When the MACD is positive, and the histogram is increasing, it indicates that momentum is building. In this instance, the price tends to rise, which can be regarded as a "busy" indication.When MACD and the histogram value both decreases, it indicates that the price is most certainly falling and that the asset should be sold.
Llook at the example below to understand better
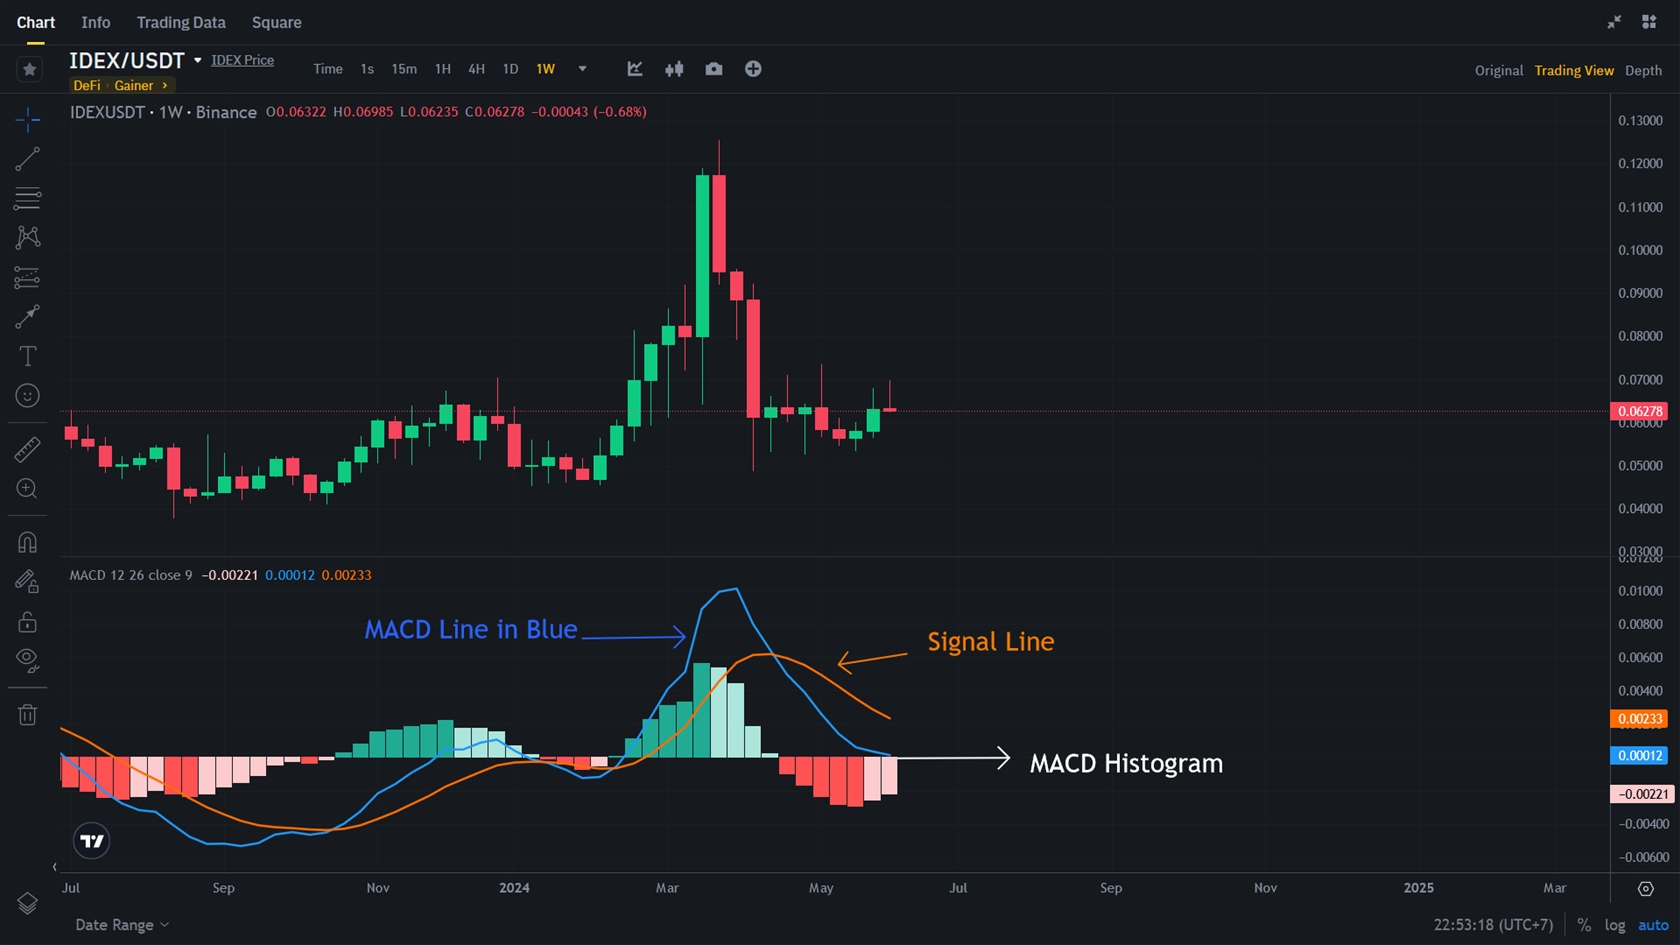 Moving Average Convergence Divergence (MACD)
How to use effectively the MACD Divergence Strategy?
- Moving average convergence/divergence (MACD) is a technical indicator to help investors identify market entry points for buying or selling.
- The MACD line is calculated by subtracting the 26-period exponential moving average (EMA) from the 12-period EMA.
- The signal line is a nine-period EMA of the MACD line.
- MACD is best used with daily periods, where the traditional settings of 26/12/9 days is the default.
The MACD Divergence
The MACD Divergence is a situation where the price creates higher tops and the MACD creates a raw of lower tops, or the price creates a lower bottom and the MACD creates higher bottoms, MACD Divergence after a significant uptrend indicates that the buyers are losing power and MACD Divergence after downtrend indicates the sellers losing power.
The most reliable way to use the MACD divergence is to combine it with price action.
Display & trade with MACD indicator on Binance exchange.
Example PEPE/USDT on D1 chart.
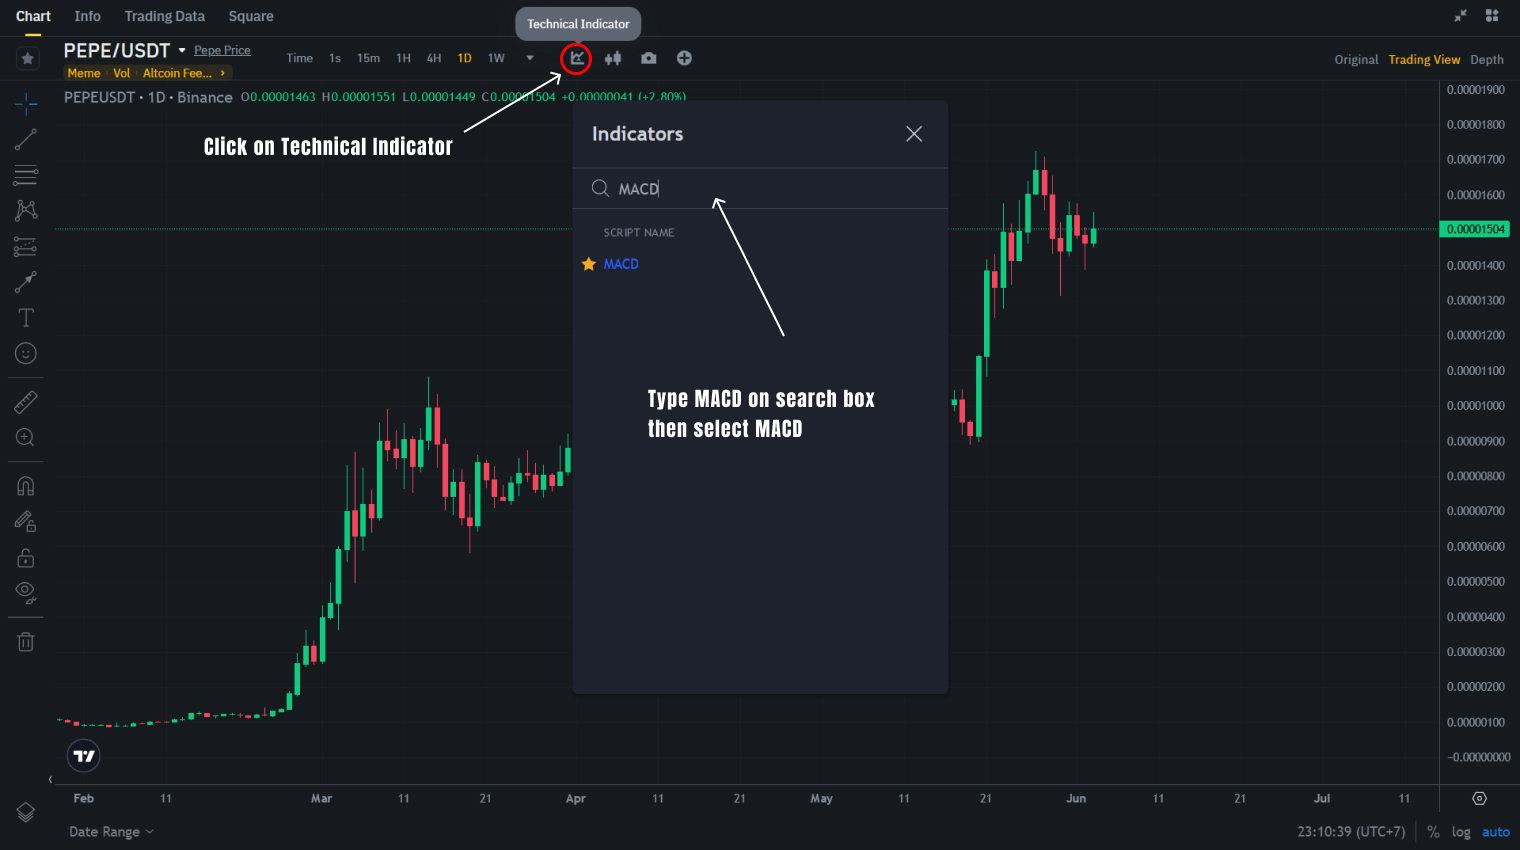
Open MACD on Binance Trading View
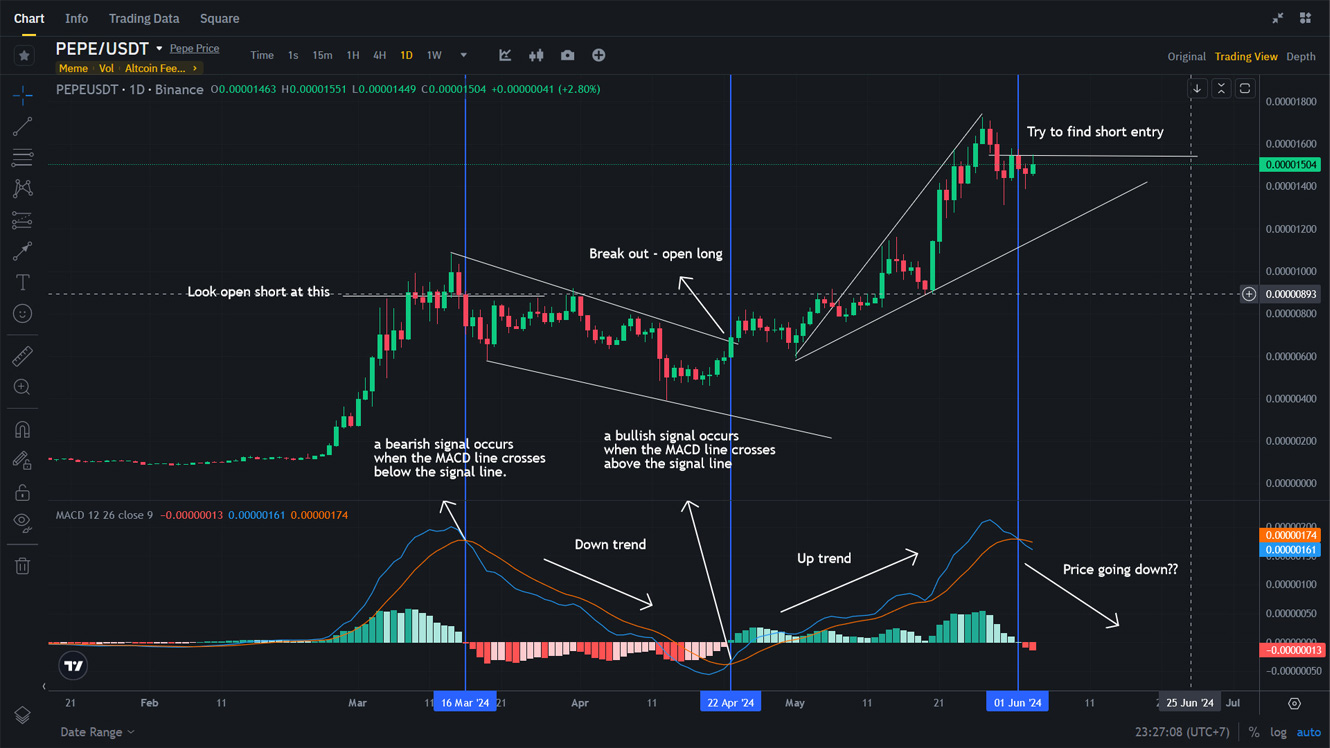 Find long, short entry with MACD
*** Note: To get a high win rate, you should combine indicators of bullish or bearish candlestick patterns and vo

 Relative Strength Index RSI. What is RSI? How to use and how to trade with RSI?
 How to use and trading with Fibonacci Extensions
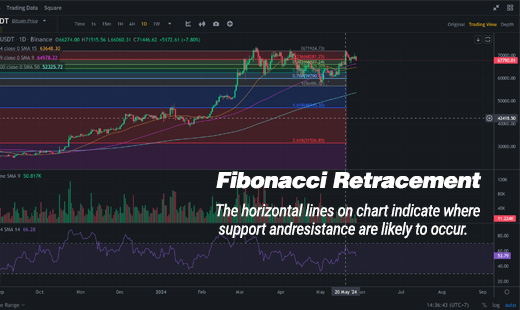 Fibonacci retracement: how to use it? And how to trade Fibonacci Levels?
 The Fibonacci Sequence discovery and fibonacci in trading
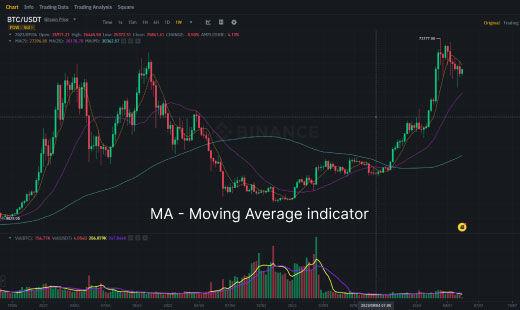 MA - Moving Average Indicator
