5 five bearish candlestick patterns
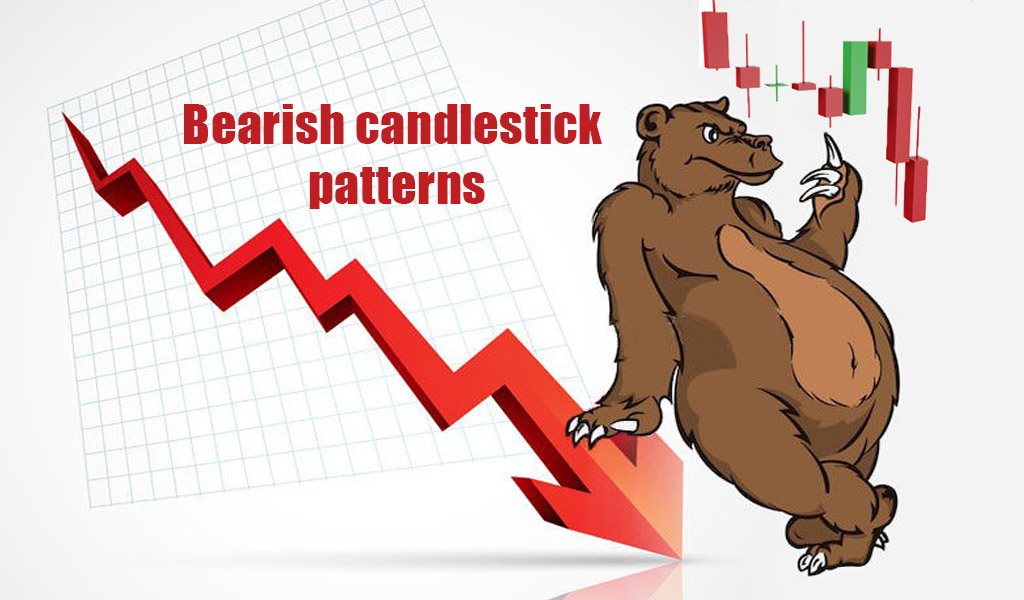
After you have understanding of basic candlestick chart patterns, let’s dive into Bearish Candlestick Chart Patterns that indicate the ongoing uptrend which is going to end and it may reverse to the downtrend.
Bearish engulfing
In technical analysis, the bearish engulfing pattern is a chart pattern that can signal a reversal in an upward price trend. Comprising two consecutive candles, the pattern features a smaller bullish candle followed by a larger bearish candle that engulfs the first. This formation is considered a strong indicator that the prior upward momentum is waning and a reversal is on the horizon.
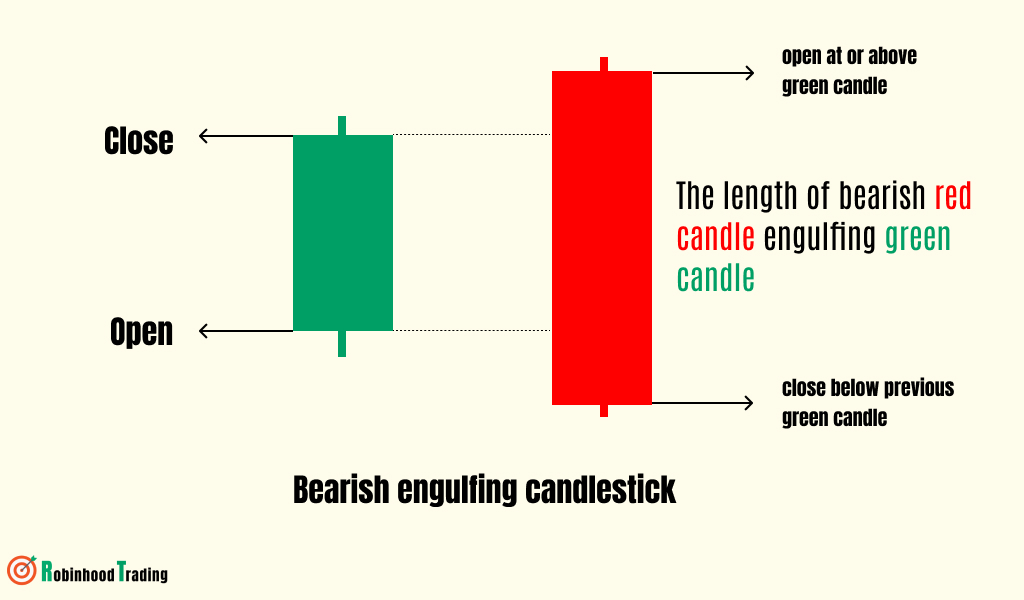
A bearish engulfing pattern can occur anytime, but it is more significant if it occurs after a price advance. This could mark the end of the uptrend or a pullback from an upswing to a more significant downtrend.
Ideally, both candles are of decent size relative to the price bars around them. Two very small bars may create an engulfing pattern, but it is far less significant than if both candles are large, showing more volatility.
The pattern has less significance in choppy sideways markets when there’s volatility but no clear trends have emerged.
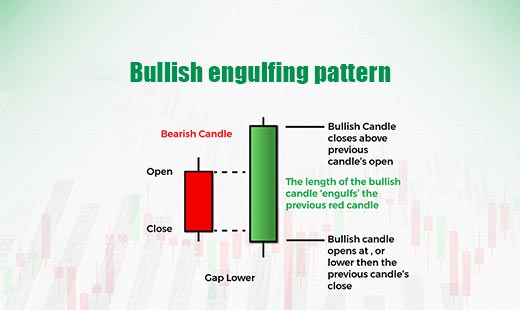
Learn how to trade with bearish and bullish engulfing patterns
Below is an example of the Bearish Engulfing pattern as shown in the daily chart of GBP/USD
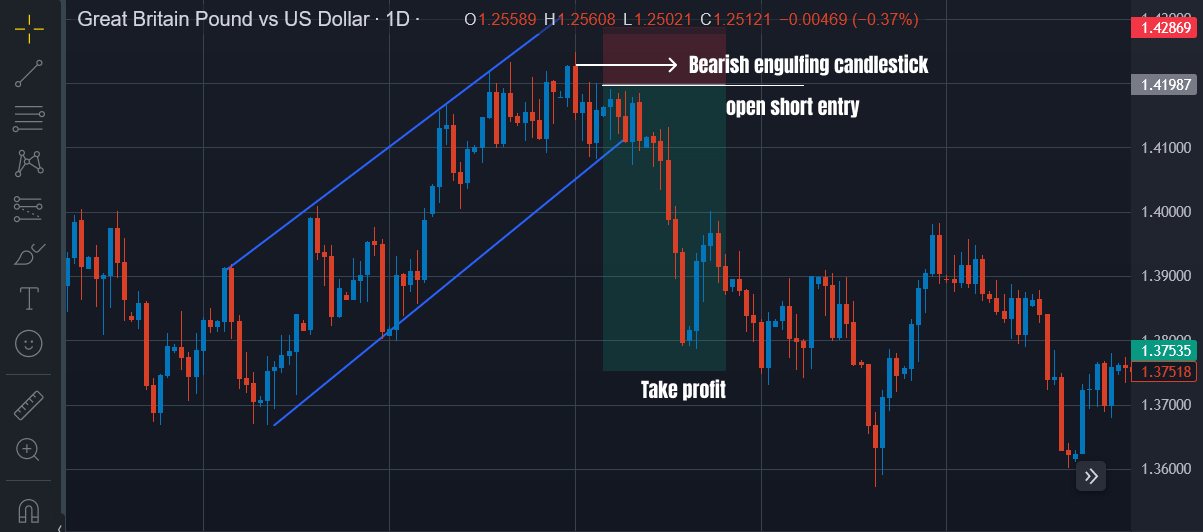 Dearish engulfing pattern exam
The hanging man candlestick pattern
The hanging man is a Japanese candlestick pattern that signals the reversal of an uptrend.
Selling pressure is the key to recognizing this pattern. Inside the formation of the candle, there is considerable selling pressure to begin with.
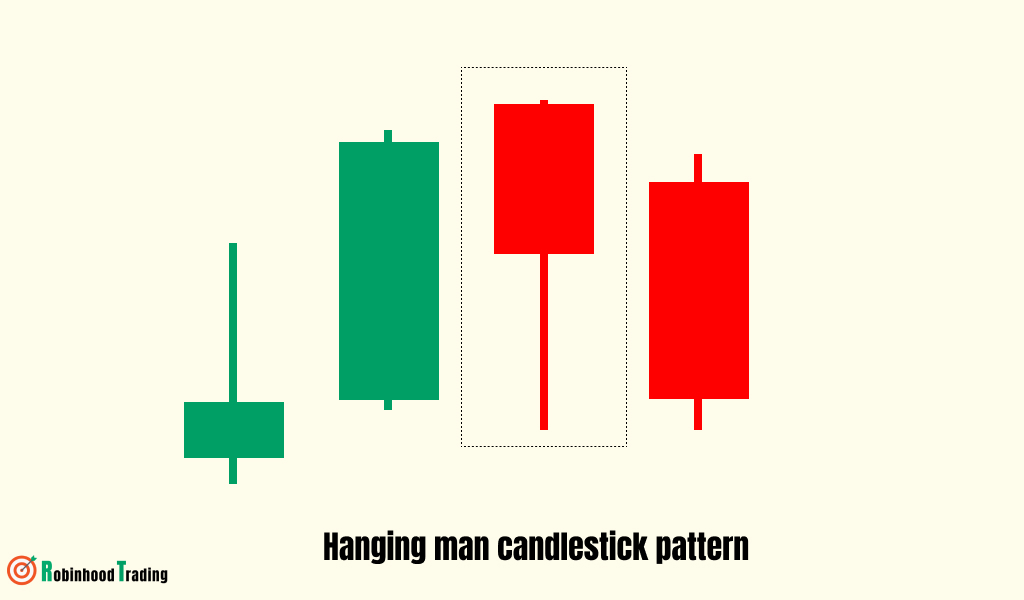 The hanging man consists of a small body with an elongated lower wick.
How to Identify and use the hanging man?
The hanging man formation signals a trend reversal. Best of all, it’s simple to identify and use. As you can see in the BTC/USD chart below, the hanging man occurs during an uptrend.
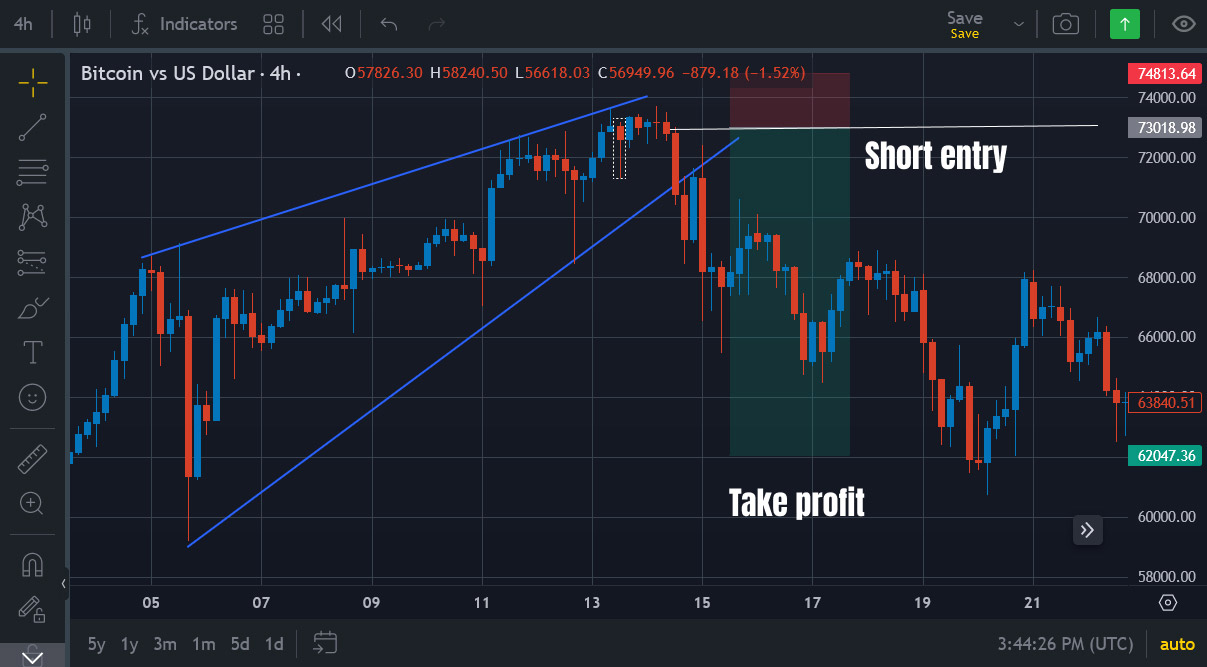
Not every hanging man candlestick pattern indicates a decrease in price. There must be additional signals to determine such as: the selling volume of the hanging man candlestick, which model is the price moving in? The candles that follow the hanging man candle confirm that buying pressure has been exhausted
Shooting star candlestick pattern
A shooting star candlestick is a type of price chart pattern that is created when a security’s price increases initially after opening and then falls close to the opening price before the market closes. A shooting star candlestick is structured by a small body, a long upper shadow or wick indicating the increase in price and buying pressure and a short lower shadow or wick indicating the price drop. Shooting star candlesticks signify the start of a bearish market trend where the prices start to decline. Bearish trend reversals are, however, confirmed after analyzing the two or three consecutive candlestick patterns that follow a shooting star, to ensure maximum certainty.
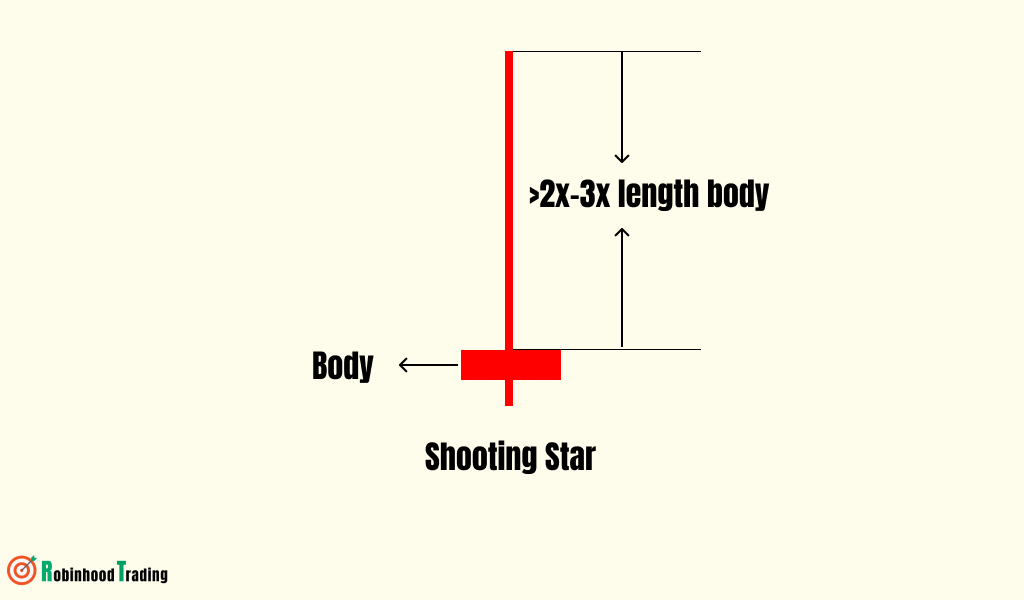
Shooting star candlestick patterns are used in technical analysis by traders to predict upcoming bearish trends. The decline in the price is considered a signal that the sellers have taken over the market. To trade with shooting stars, investors need to focus on three main points including finding the entry point, using stop-loss and deciding on the target profit. Traders commonly wait for the consecutive candlestick pattern when they spot a shooting star pattern to confirm the price declines. They consider options such as selling or shorting if the pattern following a shooting star also indicates a price drop. Shooting star patterns, thereby, help traders make trading decisions based on upcoming market trends.
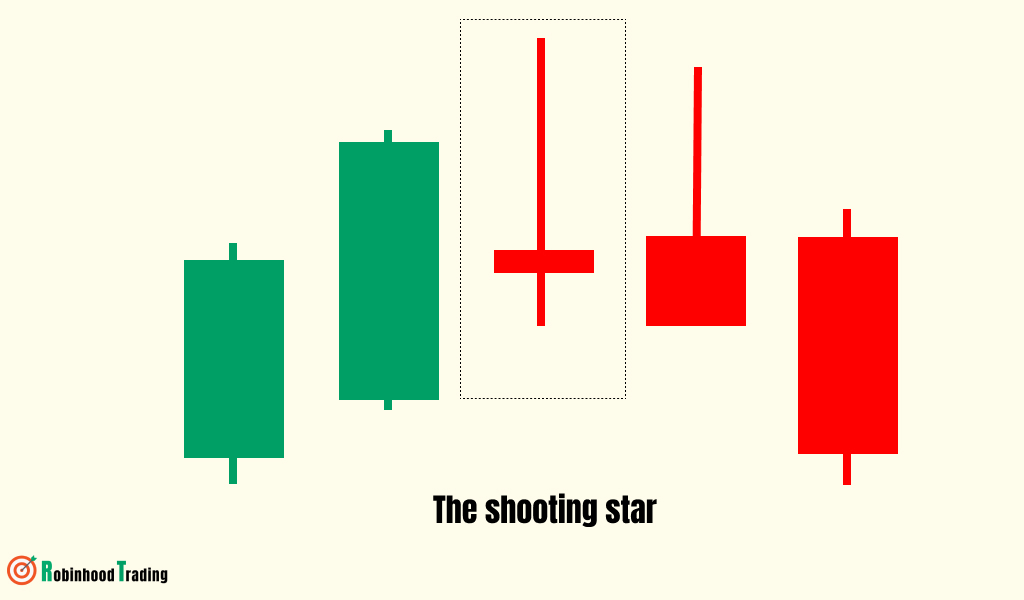 Shooting star candlestick pattern
Shooting star example: Where would we set up a short entry?
BTC/ USDT chart provides a great example of this pattern during a recent intraday session. Notice that the trend was clearly upward and becoming extended. The BTC coin makes a climactic push to new highs, then reverses on increased volume.
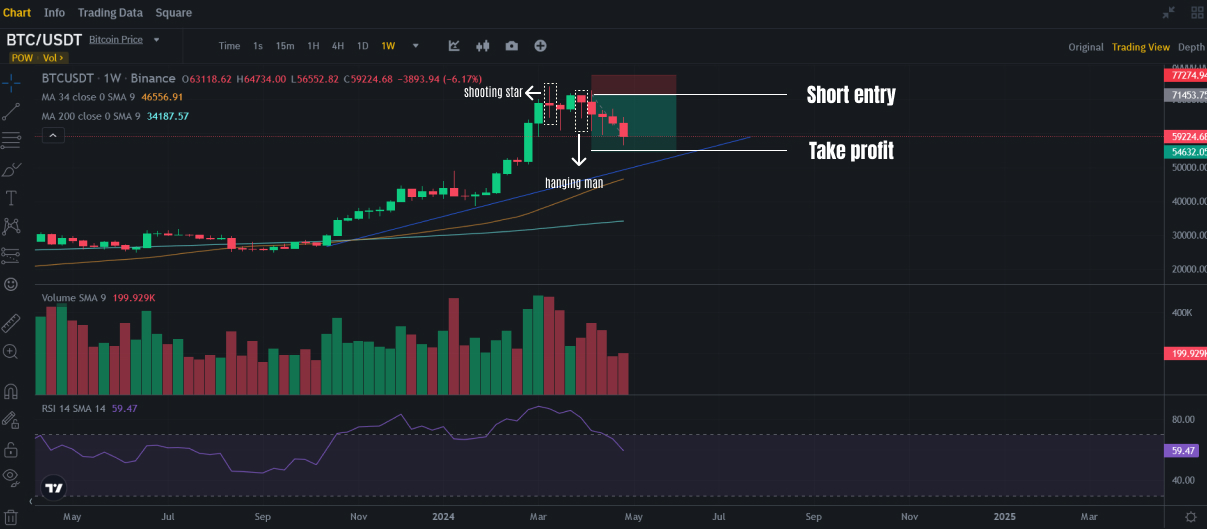 Bitcoin chart - Shooting star candlestick
The evening star candlestick patterns
An evening star is a candlestick pattern that's used by technical analysts to predict future price reversals to the downside. So Evening star candlestick patterns are bearish candlestick patterns.
The evening star pattern is rare but it's considered by traders to be a reliable technical indicator.
Included the Evening Star with the Evening Doji Star because they are very similar, both in style and in context.
Evening star patterns are associated with the top of a price uptrend, signifying that the uptrend is nearing its end.
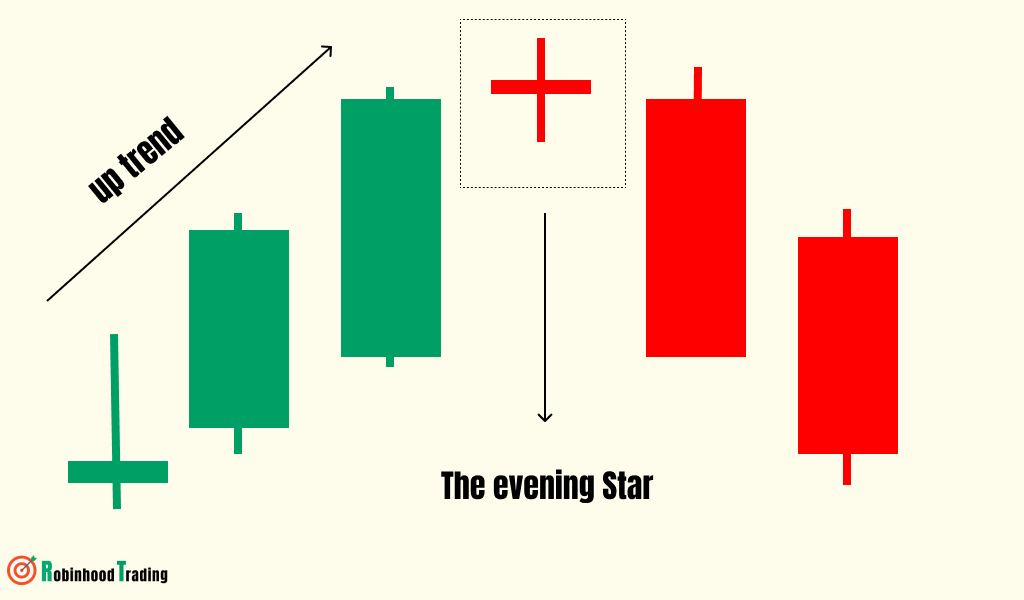
How to use evening star candlestick to find entry
The evening star candlestick pattern is a useful technical analysis tool for traders as it provides a visual representation of a likely trend reversal. This candlestick pattern is also used by traders as an entry signal for a short position or as a sell signal. Traders use the high of the evening star pattern as the stop-loss level. The closest support level or prior low can be used by traders as a profit objective for their short position.
We can see that the evening star pattern is formed in the BNB/USDT chart below.
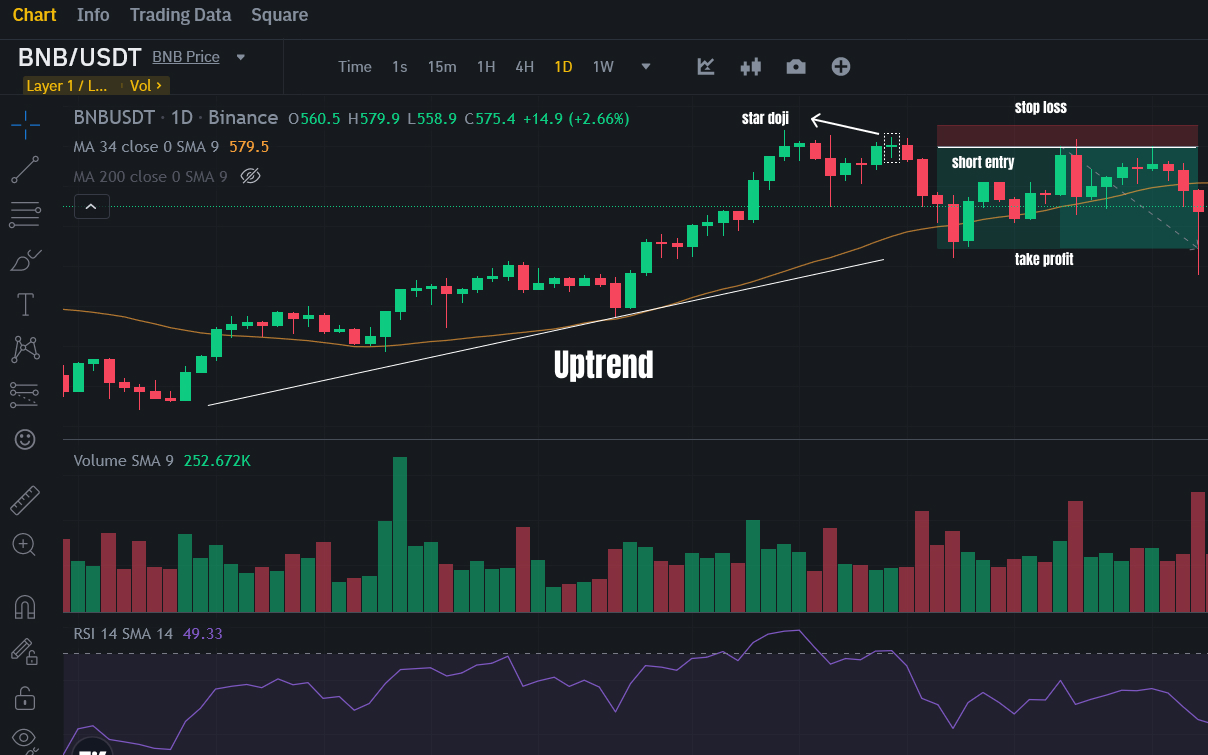 BNB/USDT evening star candlestick pattern
Dark Cloud Cover and Tweezer Top candlestick patterns
These 2 bearish candlestick models are quite similar
Overview Dark Cloud Cover model first
Dark Cloud Cover is the opposite of a bullish reversal pattern called Piercing Line. For the bearish pattern, it must first have a solid green bar continuing the uptrend.
After the bullish candle closes, we expect to see another candle try to make new highs. This new candle fails, then closes more than midway into the body of the 1st candle. Hence, the overhead supply is called “dark cloud cover.”.
One of the best ways to play this pattern is in an overall downtrend during a short term reversal. As the stock tries to rally into resistance, you can anticipate the end of the rally.
Formation of Dark Cloud Cover
The dark cloud cover pattern is made up of two candlesticks; the first is green and the second red. Both candlesticks should have fairly large bodies and the shadows are usually small or nonexistent, though not necessarily. The red candlestick must open above the previous close and close below the midpoint of the green candlestick's body. A close above the midpoint might qualify as a reversal, but would not be considered as bearish.
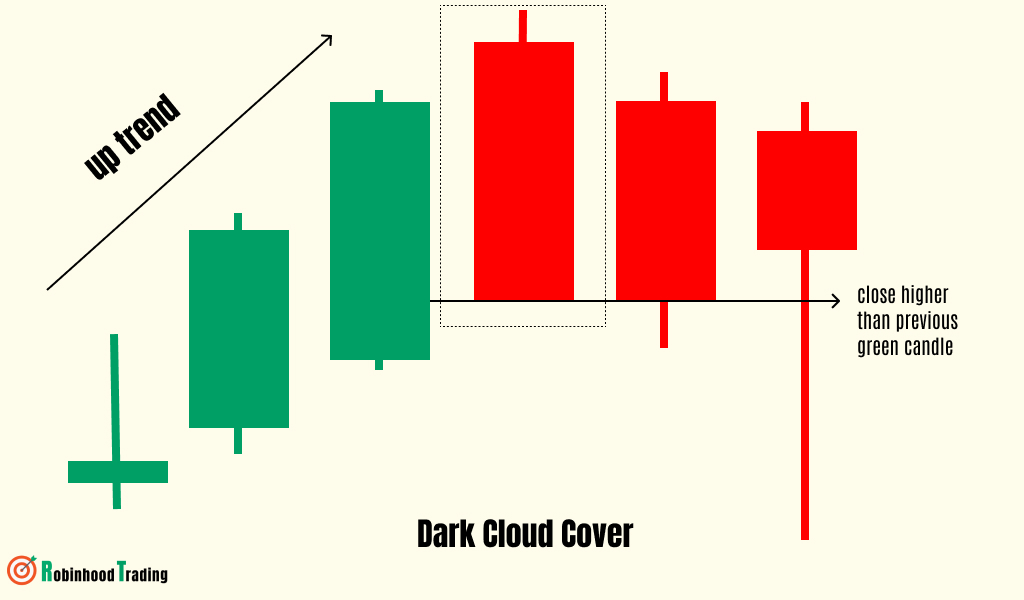
Entry
Positions should be entered as the stock breaks the prior bar with stops set at the high of the candle.
Tweezer Top candlestick pattern
A Tweezer Top occurs during an uptrend when buyers push prices higher, often ending the session near the highs, but are not able to push the top any further.
Formation of Tweezer Top
As a bearish pattern, the two candles should share roughly the same high if possible. The matching tops are usually composed of shadows (or wicks) but can be the candle’s bodies as well.
The 1st element is the wide body bullish candle signaling potential exhaustion in an uptrend. This is followed by weak or no effort to continue higher, hence the reversal.
Ideally, volume is increasing during both of these candles as supply is added to the market as weak hands are tempted to continue buying here.
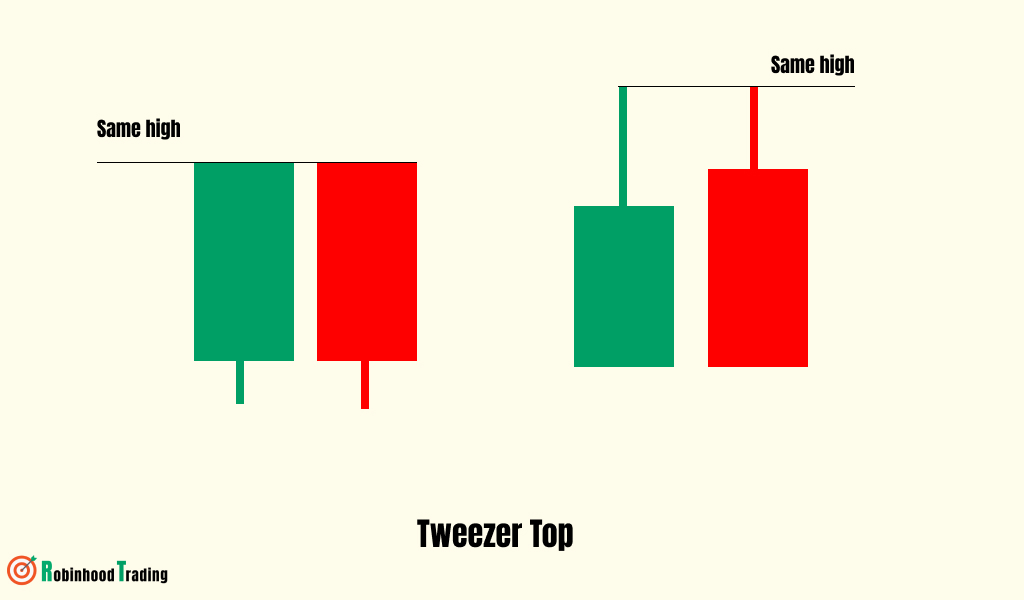
Entry
Entry can be made on a close below the reversal candle with a stop set at the high.
*Note: Remember, these patterns are most effective when considered in the context of overall market trends and other technical indicators. Always combine candlestick analysis with other tools for better decision-making!

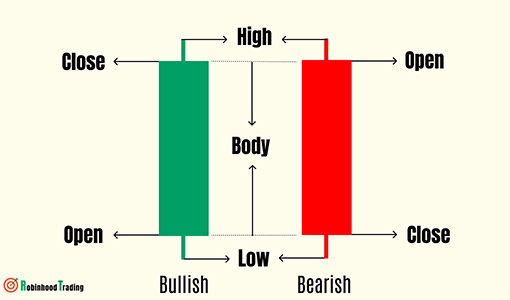 Simple candlestick patterns
 3 three bullish candlestick patterns
 Candlestick patterns for trader