Relative Strength Index RSI. What is RSI? How to use and how to trade with RSI?
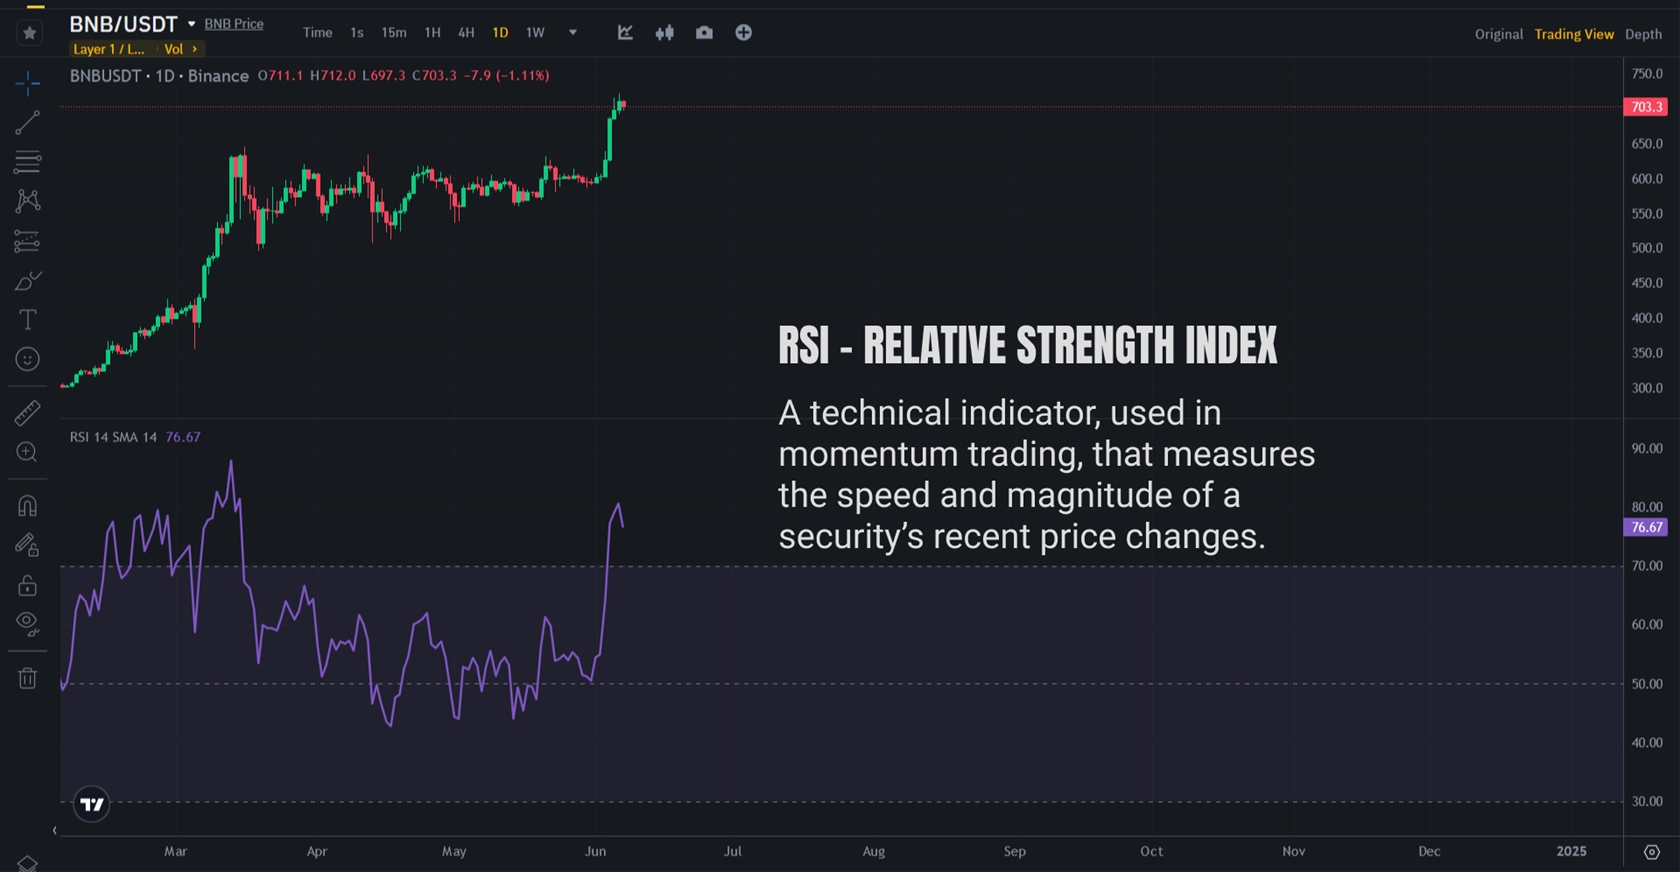
The Relative Strength Index (RSI) is a momentum indicator used by technical analysts to gauge whether or not a market is overbought (bearish) or oversold (bullish).
Why Is RSI Important?
- Traders can use RSI to predict the price behavior of a security.
- It can help traders validate trends and trend reversals.
- It can point to overbought and oversold securities.
- It can provide short-term traders with buy and sell signals.
- It's a technical indicator that can be used with others to support trading strategies.
What is Relative Strength Index (RSI).
The Relative Strength Index (RSI) was developed by J. Welles Wilder and introduced in his 1978 book, "New Concepts in Technical Trading Systems." The RSI is a momentum oscillator that measures the speed and change of price movements.
The RSI oscillates between 0 and 100 and is typically used to identify overbought or oversold conditions in a market.
What is RSI used for?
When a crypto currency or Stock is rallying, assume there’s an influx of buyers willing to pay higher prices for the shares. Similarly, when a crypto currency or stock price is falling, assume the opposite, that sellers are trying to unload assets onto buyers who are willing to pay only lower prices. But amid the bidding-up or offering-down process, might there be a way to gauge whether a stock might be “overbought” and ripe for a pullback, or “oversold” and poised for a bounce?
In terms of big-picture fundamentals, there is no tool designed to measure the likelihood of a short-term reaction, whether a pullback or bounce. But on a technical level, there is a momentum oscillator designed to do just that. It’s called the Relative Strength Index, or RSI for short, and its purpose is to measure the speed and size of a stock’s price movements, giving investors a clue as to when a price swing might be set for a break before resuming or reversing its original direction.
Understand & read RSI.
To calculate RSI, fourteen-time periods (e.g., days, weeks, hours) are typically used, but optimization of the calculation may reveal that 10 or 21 periods, for example, are a better indication of market sentiment.
If we are given a set of 15 periods where the price change of each is:
(1,-2,3,8,2,-3,1,8,2,4,-6,9,-1,6,7)
The RSI is calculated using the following formula:
The standard period used for calculating the RSI is 14 periods, but this can be adjusted to suit the specific trading strategy.
Steps in RSI Calculation:
- Calculate the average gain and average loss over the specified period.
- Compute the Relative Strength (RS): Divide the average gain by the average loss.
- Calculate the RSI using the formula above.
Interpretation of RSI
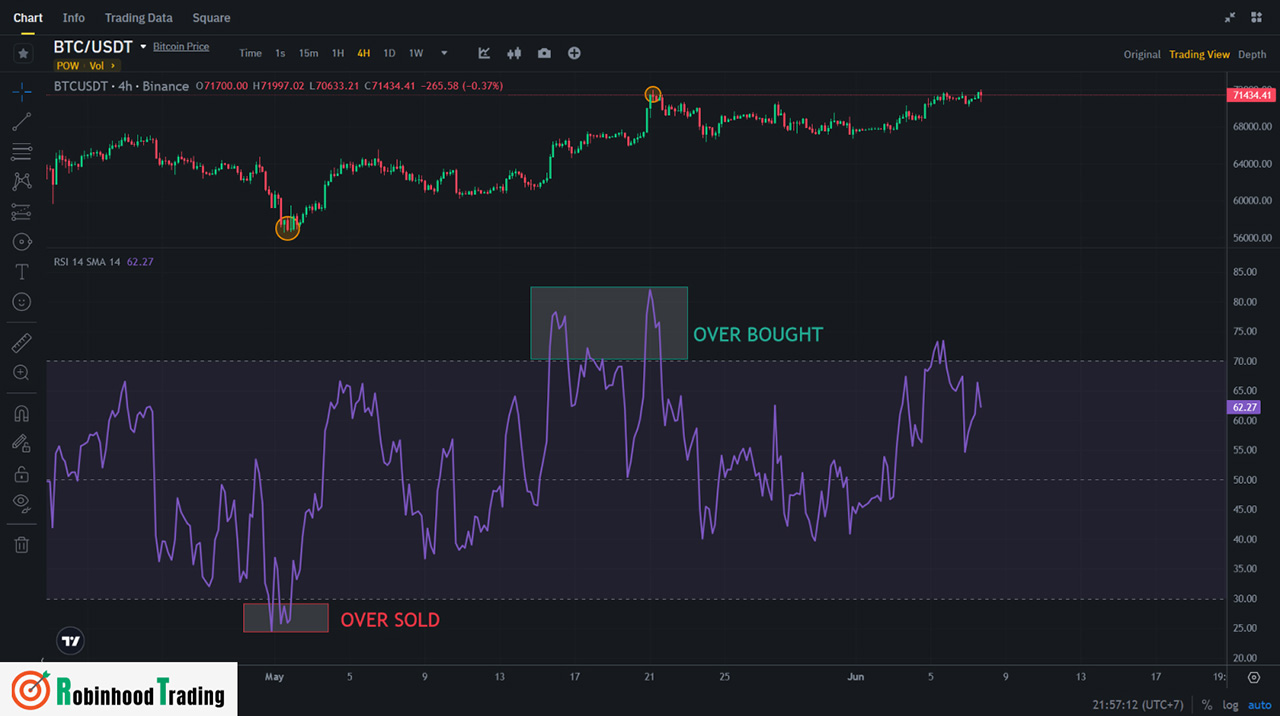
- Overbought Condition: When the RSI is above 70, it indicates that the asset might be overbought or overvalued and could be primed for a trend reversal or corrective pullback.
- Oversold Condition: When the RSI is below 30, it suggests that the asset might be oversold or undervalued and could be ready for a trend reversal or corrective rally.
Applications of RSI
- Identifying Overbought and Oversold Levels: Traders use the RSI to spot potential reversals by looking for overbought (above 70) and oversold (below 30) conditions.
- Divergence: RSI can be used to identify divergence, where the price of an asset is moving in the opposite direction of the RSI. This can indicate a potential reversal.
- Trend Confirmation: RSI can help confirm the strength of a trend. For example, in an uptrend, the RSI tends to stay above 30 and often hits 70. Conversely, in a downtrend, the RSI usually remains below 70 and often hits 30.
- Failure Swings: This is a pattern in RSI analysis where the RSI fails to reach a new high or low, which can signal a potential reversal.
How to read RSI on chart.
The Relative Strength Index is presented as a graph, usually found along with a chart of the stock’s price over time. Comparing the RSI chart to price trends can provide investors with more information than RSI alone.
The y-axis (vertical axis) of the RSI chart shows the variation in RSI value, typically in the range of 0 to 100. Most graphs also have vertical lines at the 30 and 70 marks so you can easily tell if an asset is outside of that range (meaning it may be oversold or overbought). The x-axis (horizontal axis) of the chart shows the time period in question, generally 14 days.
How to use RSI to Buy long or Sell (short) Crypto Currency or Stock.
It’s important to remember that these overbought and oversold levels are theoretical. They provide a reference point for possible reactions against the trend (aka corrections). Whether a stock is truly overbought or oversold on the basis of real demand is beyond the oscillator’s capacity to determine. In other words, don’t take these technical indicators as a reflection of fundamental conditions.
So, how might you use the RSI to enhance your trading strategy? Here are a few suggestions
Anticipate tops and bottoms. Potential market tops can occur when the RSI goes above 70; relative bottoms, when RSI moves below 30. These are relative tops and bottoms that may eventually continue in their original direction or reverse, depending on the fundamental conditions of the stock or the broader market.
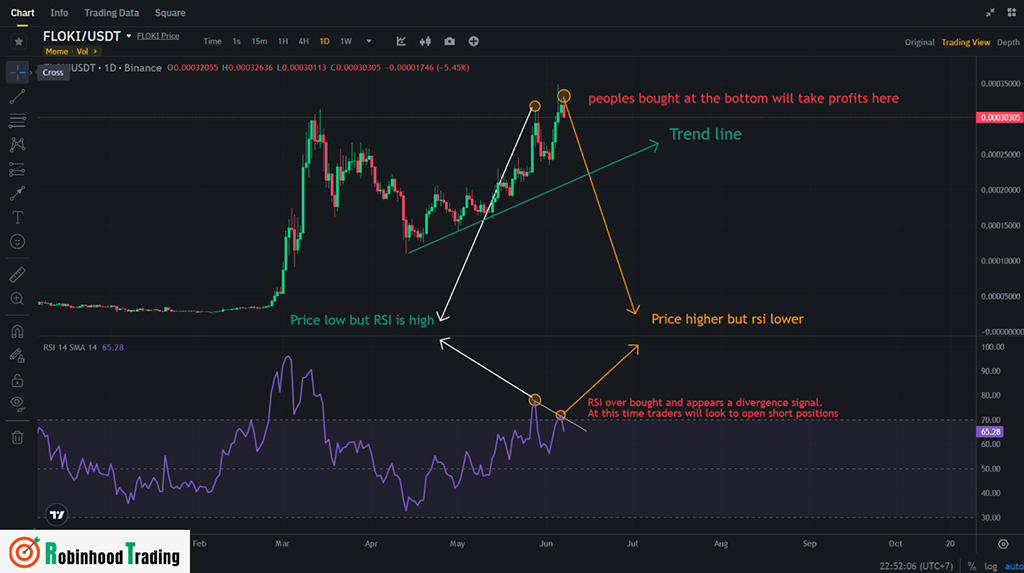
Chart patterns on the RSI. There are chart patterns that may show up in the RSI but not on the actual bar chart. For instance, bottoming and topping formations may contradict the price action. This is known as divergence, and it’s a critical indication of a potential trend reversal (see below).
Take profit and find short entry with RSI
Divergence. When the RSI reverses upward from below the 30 range while the price trend continues to swing lower, that’s considered a bullish divergence, and a sign that a stock may be bottoming and poised to bounce. When the RSI falls from above the 70 range while the price trend continues to swing higher, that’s considered a bearish divergence, signaling that a top may be in place and that prices are likely to pull back.
Failure swings. In an uptrend, prices must make higher highs and higher lows. If a price swing fails to make a higher high while the RSI scale is above 70, it’s a strong indication that prices are likely to reverse toward the downside.
In contrast, a downtrend must continue to make lower lows and lower highs. If prices fail to break below their previous lows while RSI is below 30, it’s an indication that prices may soon reverse toward the upside.
Support and resistance. Support and resistance can sometimes show up on the RSI before the price chart, giving you a heads-up that prices may soon reverse course.
Finding and using RSI on Binance tradingview.
Next we will show you how to display RSI on Binance TradingView
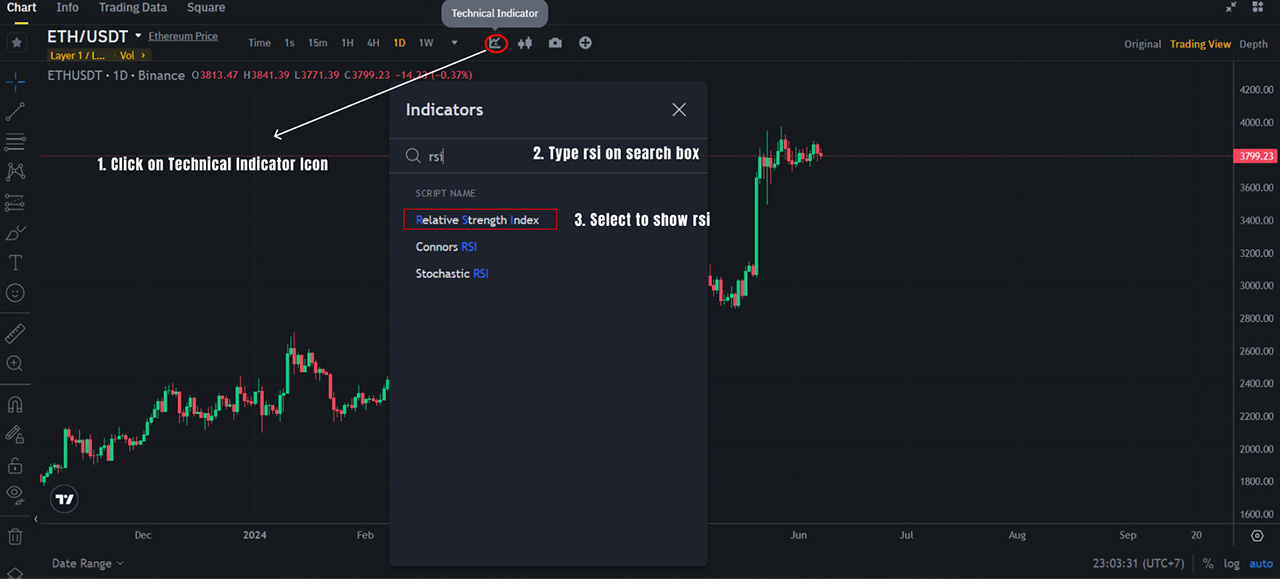
Show RSI on ETH/USDT chart on Binance TradingView
Key concepts
The RSI provides technical traders with signals about bullish and bearish price momentum, and it is often plotted beneath the graph of an asset’s price.
An asset is usually considered overbought when the RSI is above 70 and oversold when it is below 30.
The RSI line crossing below the overbought line or above the oversold line is often seen by traders as a signal to buy or sell.
The RSI works best in trading ranges rather than trending markets.

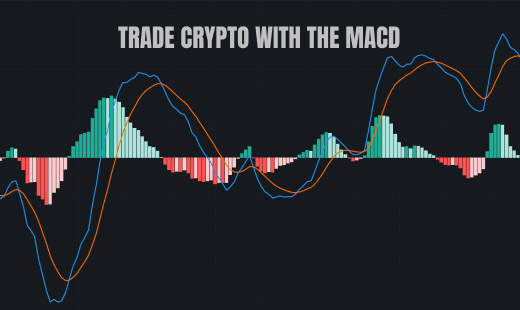 What is MACD Moving Average Convergence Divergence and how to use?
 How to use and trading with Fibonacci Extensions
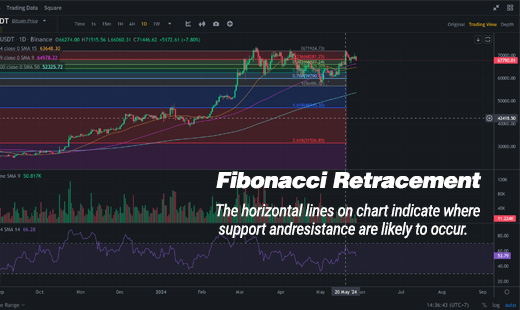 Fibonacci retracement: how to use it? And how to trade Fibonacci Levels?
 The Fibonacci Sequence discovery and fibonacci in trading
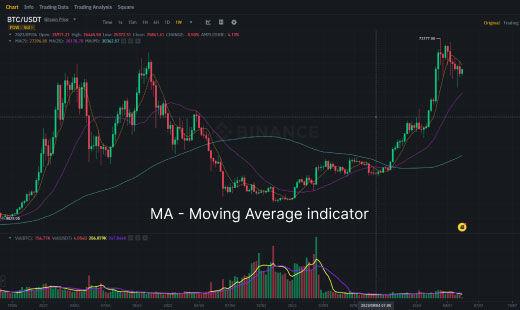 MA - Moving Average Indicator