MA - Moving Average Indicator
.jpg)
What is the moving average(MA) indicator? And How to use the best moving average and the best MA indicator setting for your trading.
In this article, we will tell you about one of the most popular indicators - Moving Average (MA). Indicator for every trader and how to use MA determine A Bullish or bearish signal.
What is the moving average(MA)?
The moving average (MA) indicator is a widely used technical analysis tool in financial markets. It sums up the data points of a financial security over a specific time period and divides the total by the number of data points to arrive at an average and It is called a “moving” average because it is continually recalculated based on the latest price data.
MA designed to smooth out price data over a specified period of time to identify trends and potential reversals.
Analysts or investors then use the information to determine the potential direction of the asset price. It is known as a lagging indicator because it trails the price action of the underlying asset to produce a signal or show the direction of a given trend.
How does MA work?
Calculation: To compute a moving average, you take the average price of a security over a certain number of periods. For example, a 10-day moving average calculates the average closing price of the last 10 days.
Smoothing: By averaging out price fluctuations over time, the moving average creates a smoother line, which makes it easier to identify trends.
Types of Moving Averages
1. Simple Moving Average (SMA): It calculates the arithmetic mean of prices over a specified period.
The formula for Simple Moving Average is written as follows:
SMA = (A1 + A2 + ……….An) / n
where:
A=Average in period n
n=Number of time periods
A simple moving average (SMA) is calculated by taking the arithmetic mean of a given set of values over a specified period. A set of numbers, or prices of stocks, are added together and then divided by the number of prices in the set.
2. Exponential Moving Average (EMA): It gives more weight to recent prices, making it more responsive to current price movements compared to SMA.
The exponential moving average gives more weight to recent prices in an attempt to make them more responsive to new information. To calculate an EMA, the simple moving average (SMA) over a particular period is calculated first.
Then calculate the multiplier for weighting the EMA, known as the "smoothing factor". The formula for calculating the multiplier is as follows:
Multiplier = [2 / (Selected Time Period + 1)]
For example, if the time period in question is 10, the multiplier will be calculated as follows:
Multiplier = [2 / (10+1)] = 0.1818
The smoothing factor is combined with the previous EMA to arrive at the current value. The EMA thus gives a higher weighting to recent prices, while the SMA assigns an equal weighting to all values.
The last step is to calculate the current exponential moving average
Current EMA = [Closing Price – EMA (Previous Time Period)] x Multiplier + EMA (Previous Time Period)
3. Weighted Moving Average (WMA): Similar to EMA, but assigns different weights to prices within the period.
How to show and use Moving Average(MA) on Binance TradingView?
1. Click on Trading View
2. Click on Technical Indicator and type to search 'MA' or “Moving Average” in the search bar, and you'll see various moving average options. The select “Moving Average”.
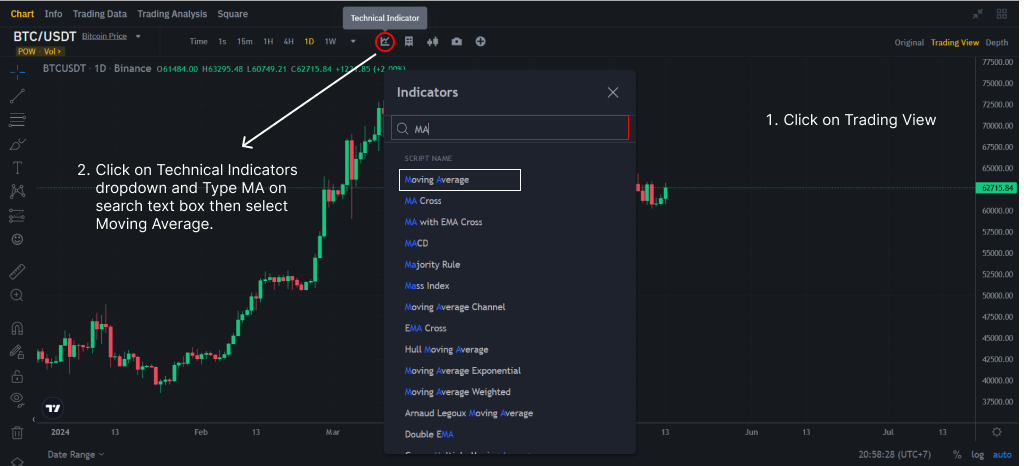 Open MA on Binance Tradingview
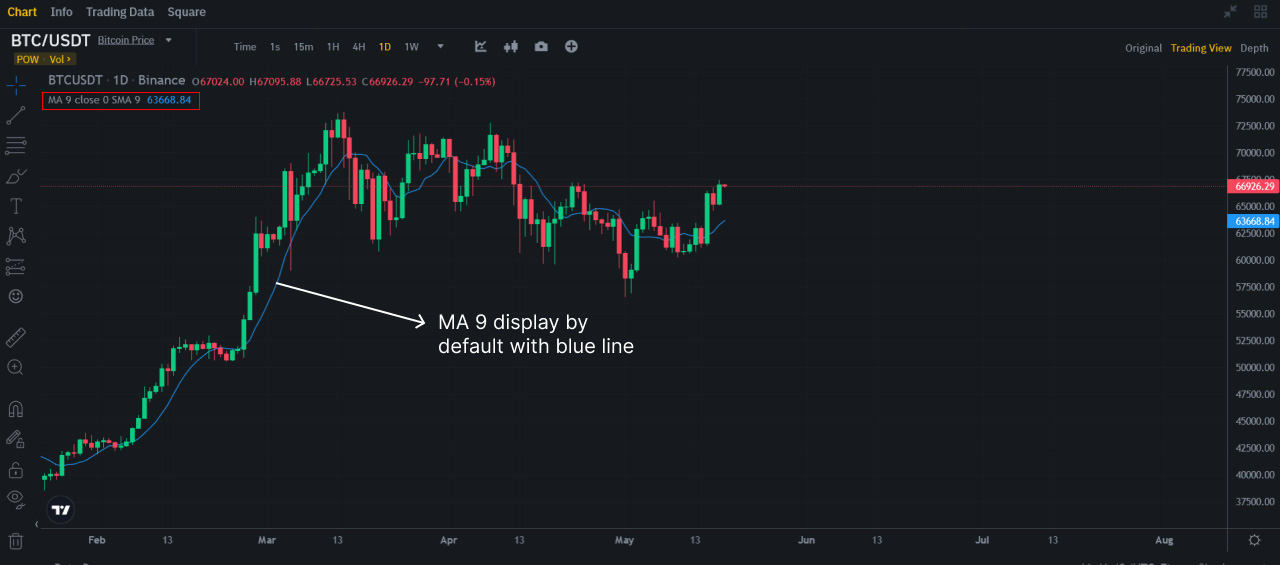 Display MA on Binance Tradingview
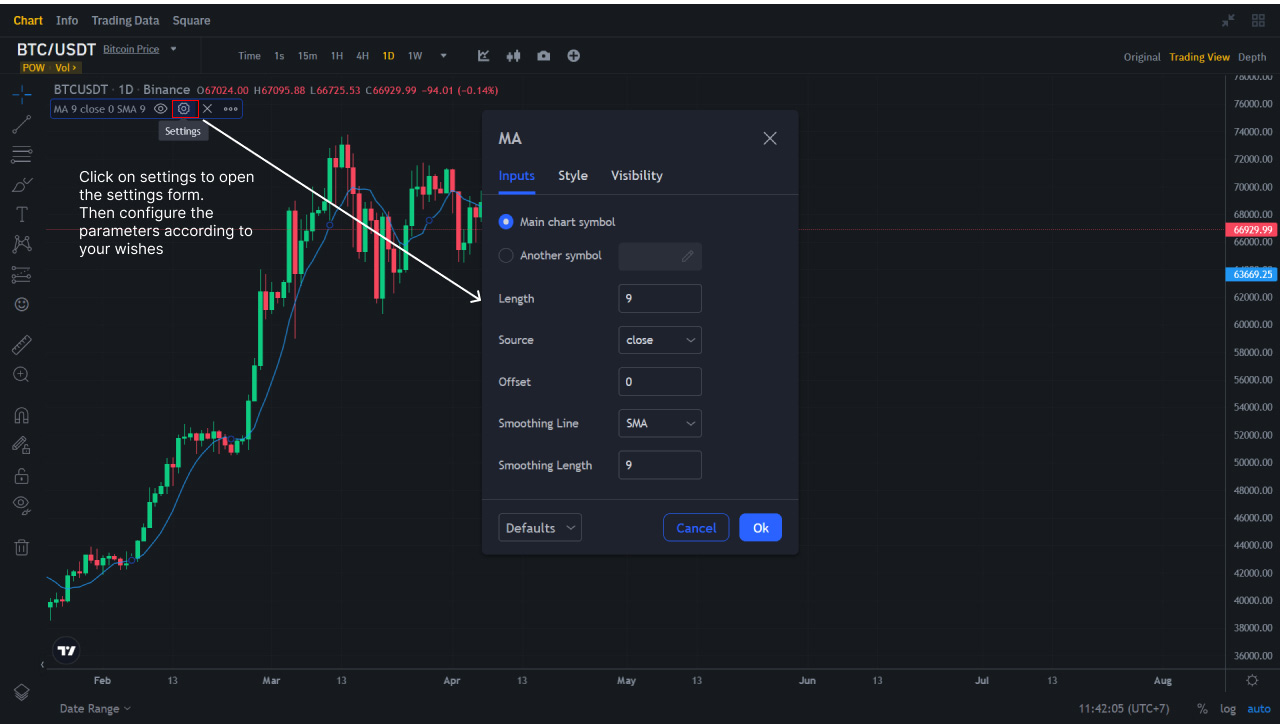 Setting MA on tradingview
What time periods should we use in the calculation?
When calculating moving averages, the time period used should depend on how closely the trader wants to follow the trend.
This table should provide a good estimate:
| Short-term trend | 10-30 periods |
| Mid-term trend | 50-100 periods |
| Long-term trend | Up to 200 periods |
Most traders use 30-day, 100-day, and 200-day periods as they help identify the most significant long-term support and resistance levels. Using a larger number of periods allows more data to be studied, allowing for a more unbiased view of the overall trend.
How to use moving averages - MA determine a bullish or bearish signal?
Find out in the next section how to use moving averages and the main ways traders use an MA to identify signals.
Types of interpretation for moving averages (MA)
There are 3 main ways of using the Moving Averages for signal generation:
- Price Crossover
- Moving Average Crosses
- Indicator Crosses
Each of these crossovers can be used in both bullish and bearish scenarios. The difference between these 3 ways is the matching of different elements with the Moving Average (MA).
Price Crossover
This method is a combination of the Price data and the Moving Average. It is the simplest and most popular method of interpreting a moving average.
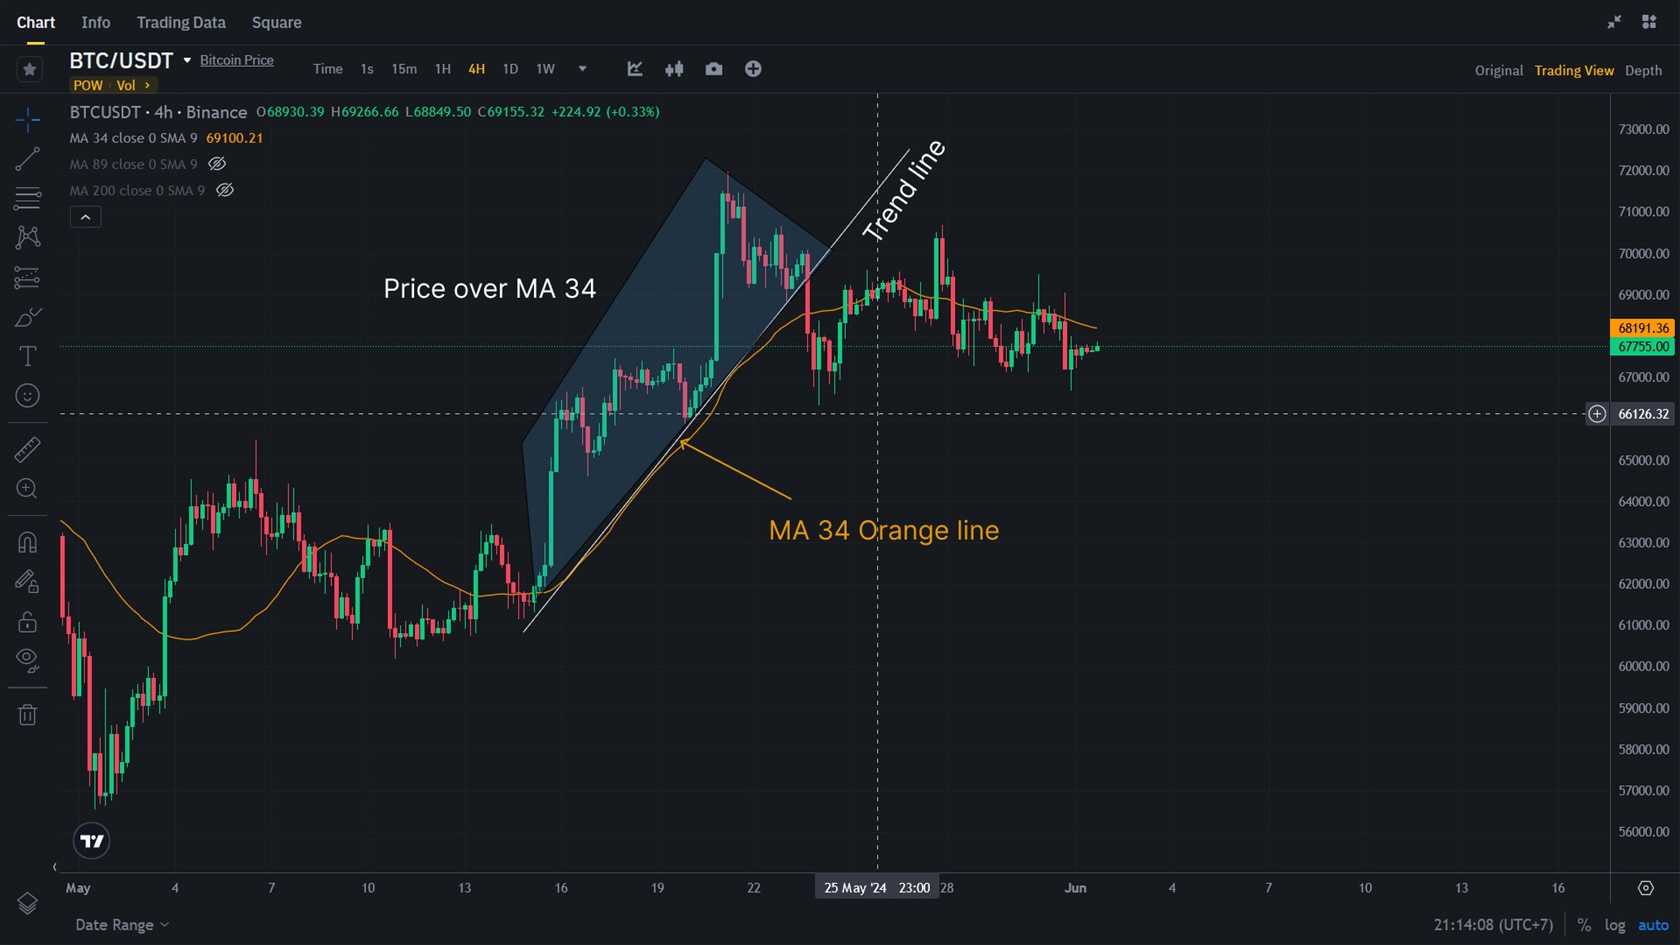
In the example above, using the BTC/USDT chart at the 4-hour timeframe, with a 34-period SMA represented by the Ogran line. When the candle indicated by the red arrow closes beneath the blue line, the price continues to head in a bearish direction. When the candle indicated by the green arrow closes above the blue line, the price continues to head in a bullish direction.
Indicator Crossover
This method is the combination of Multiple Moving Averages. Where a signal to take action is generated when the lines cross each other on the price charts.
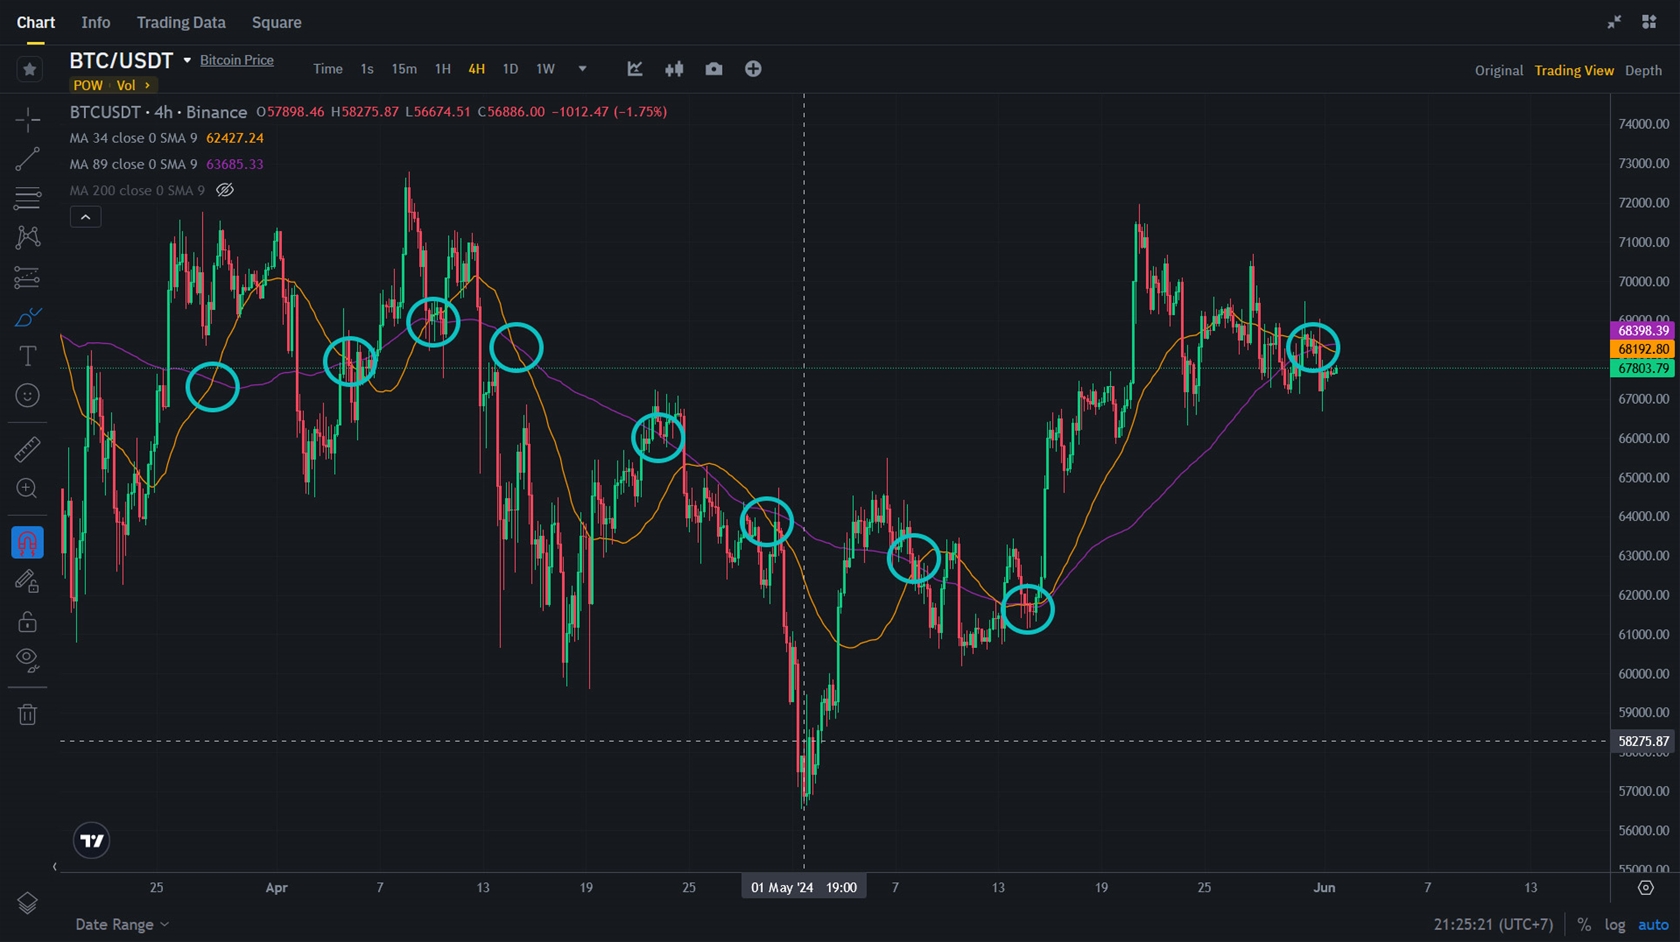
In this example above, we are using 2 Moving averages. A 34-period Moving average (Orange Line) has been added on top of the 84-period Moving average (Pupple Line). You can see that the orange line moves closer to the price. The signal for bullish momentum is spotted when the orange line crosses above the Pupple , and bearish momentum is spotted when the orange line crosses under the Pupple.
Indicator Crossover
Last but not least, we have the indicator crossover which is a combination of putting a Moving Average (MA) into an indicator.
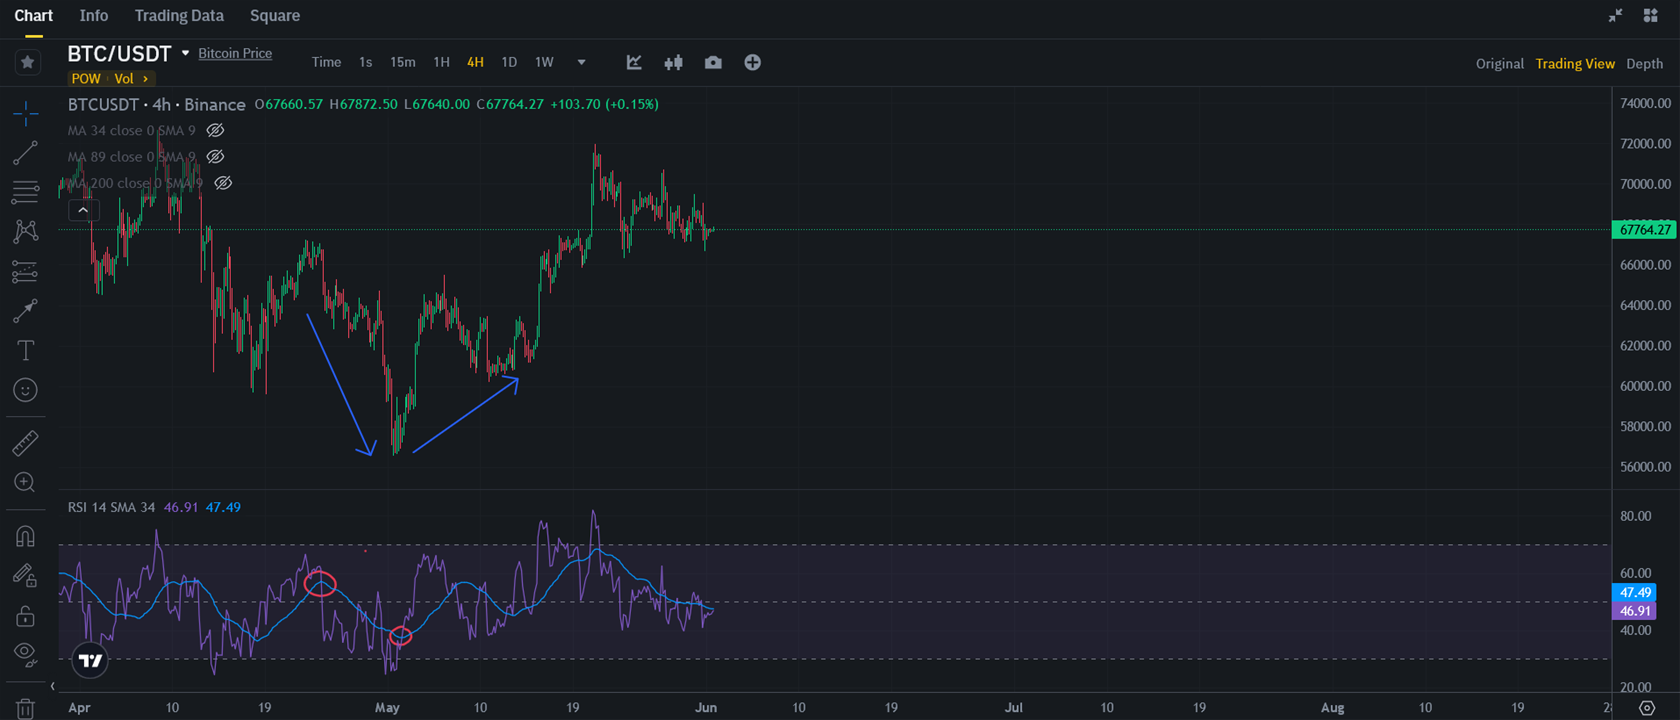
In this example, we have a RSI (14-period) indicator underneath the price chart. And now, we will be adding a 34-period MA into the RSI indicator window, instead of the price chart.
The 34-period moving average is represented by the smooth Blue line, while RSI is represented by the Light Blue line. And a signal is generated every time RSI crosses the 34-period moving average.
A bearish signal is generated when the RSI crosses above the 34-period MA, notice how the price continues to drop further as the RSI remains under the 34-period MA.
A bullish signal is generated the moment RSI crosses back above the 34-period moving average. Traders can also adjust the sensitivity of the Moving Average and Rate-of-Change to generate more signals if the market is not trending in big moves like this example.

 Relative Strength Index RSI. What is RSI? How to use and how to trade with RSI?
 What is MACD Moving Average Convergence Divergence and how to use?
 How to use and trading with Fibonacci Extensions
 Fibonacci retracement: how to use it? And how to trade Fibonacci Levels?
 The Fibonacci Sequence discovery and fibonacci in trading