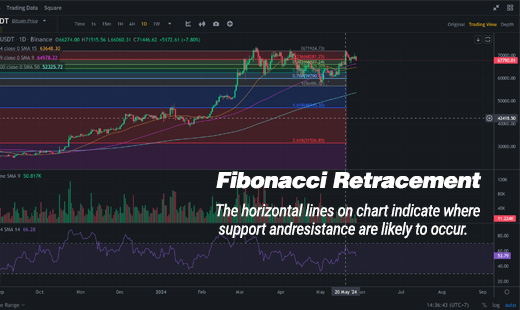
Fibonacci retracement: how to use it? And how to trade Fibonacci Levels?
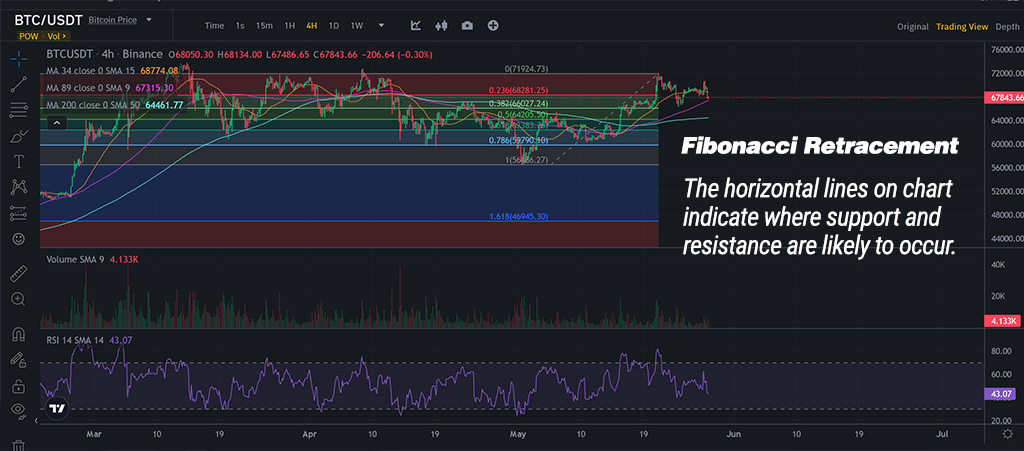
Fibonacci retracement is a technical analysis tool used in financial markets to identify potential support and resistance levels.
What is Fibonacci Retracement?
Fibonacci retracement based on the key numbers identified by mathematician Leonardo Pisano, nicknamed Fibonacci, in the 13th century.
Fibonacci sequence, a series of numbers where each number is the sum of the two preceding ones, often expressed as 0, 1, 1, 2, 3, 5, 8, 13, 21, and so on. In the context of trading, Fibonacci retracement levels are used to predict the possible future price movements of an asset by analyzing the past price movements.
Key concepts of Fibonacci Retracement
Fibonacci Levels:
In technical analysis, a Fibonacci retracement is created by taking two extreme points (usually a peak and a trough) on a stock chart and dividing the vertical distance by the key Fibonacci ratios of 23.6%, 38.2%, 50%, 61.8%, and 100%
These levels represent the potential points at which the price of an asset could retrace or reverse direction after a significant move.
Identifying Swing Highs and Swing Lows:
To apply Fibonacci retracement, you first identify the highest and lowest points in a given time period (called the swing high and swing low).
The tool is then applied by drawing lines from the swing high to the swing low (in a downtrend) or from the swing low to the swing high (in an uptrend).
Application in Trading:
Traders use these levels to identify potential entry and exit points for trades.
When the price retraces to a Fibonacci level, it may act as a support or resistance level.
For example, in an uptrend, traders might look to buy at the 38.2% or 50% retracement level, anticipating that the price will resume its upward movement.
Psychological Aspect:
Fibonacci levels often work because many traders use them, creating self-fulfilling prophecies.
When a large number of traders place buy or sell orders at these levels, it can cause the price to react accordingly.
Practical Example
Imagine a stock that has risen from $100 to $200 (a $100 move). The key Fibonacci retracement levels would be:
23.6% retracement level at $176.40
38.2% retracement level at $161.80
50% retracement level at $150.00
61.8% retracement level at $138.20
Each level is associated with a percentage. The percentage is how much of a prior move the price has retraced. The Fibonacci retracement levels are 23.6%, 38.2%, 61.8%, 50%, and 78.6%.
The indicator is useful because it can be drawn between any two significant price points, such as a high and a low. The indicator will then create the levels between those two points.
Limitations
Not Always Accurate:
Fibonacci retracement levels are not foolproof and can sometimes provide false signals.
Subjectivity: The selection of swing high and swing low points can be subjective, leading to different levels being identified by different traders.
Should be Used with Other Tools: It is generally recommended to use Fibonacci retracement in conjunction with other technical analysis tools such as moving averages, trend lines, and candlestick patterns to increase its reliability.
In summary, Fibonacci retracement is a widely used tool in technical analysis to identify potential support and resistance levels based on the Fibonacci sequence. While useful, it should be used in combination with other analysis methods to enhance trading decisions.

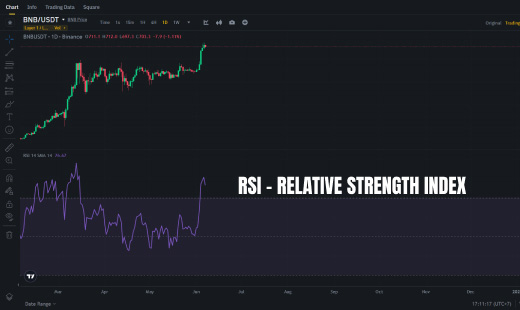 Relative Strength Index RSI. What is RSI? How to use and how to trade with RSI?
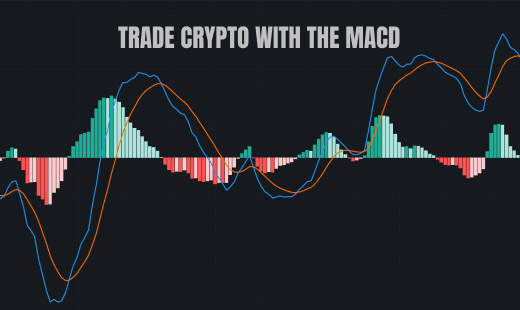 What is MACD Moving Average Convergence Divergence and how to use?
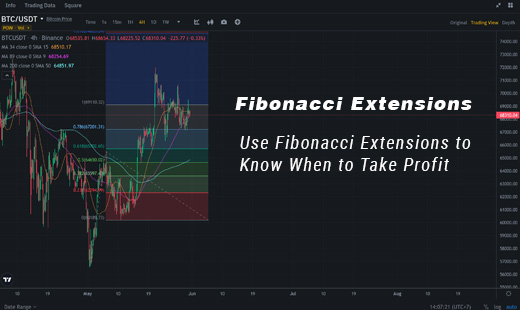 How to use and trading with Fibonacci Extensions
 The Fibonacci Sequence discovery and fibonacci in trading
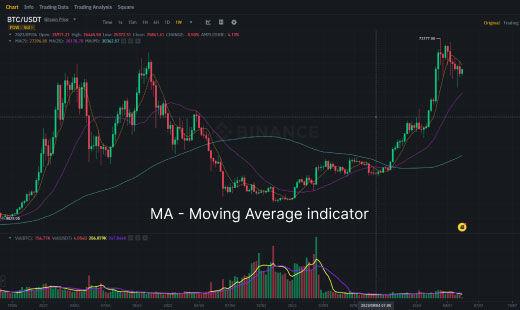 MA - Moving Average Indicator

