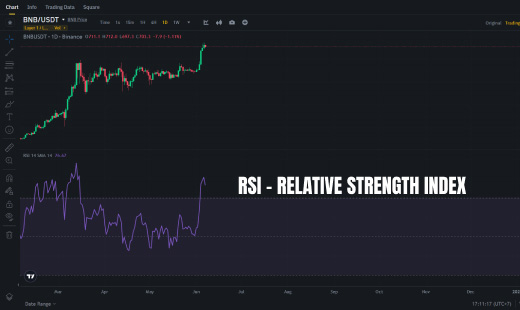
 Relative Strength Index RSI. What is RSI? How to use and how to trade with RSI?
The Relative Strength Index (RSI) is a momentum indicator used by technical analysts to gauge whether or not a market is overbought (bearish) or oversold (bullish).
 Relative Strength Index RSI. What is RSI? How to use and how to trade with RSI?
The Relative Strength Index (RSI) is a momentum indicator used by technical analysts to gauge whether or not a market is overbought (bearish) or oversold (bullish).
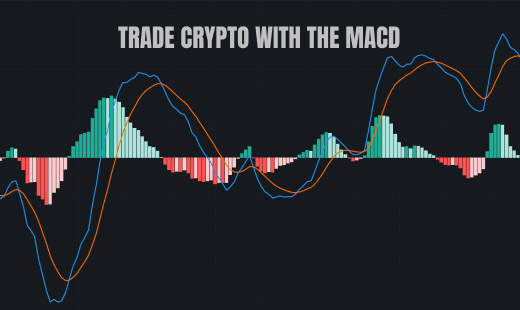 What is MACD Moving Average Convergence Divergence and how to use?
Moving Average Convergence Divergence (MACD) indicator can help you measure a stock's momentum and identify potential buy and sell signals. MACD very useful momentum indicator in cryptocurrency trading.
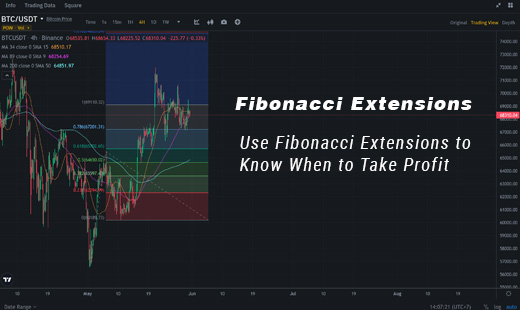 How to use and trading with Fibonacci Extensions
In the previous article we learned about Fibonacci Retracements which are very interesting, now let's learn about Fibonacci Extensions.
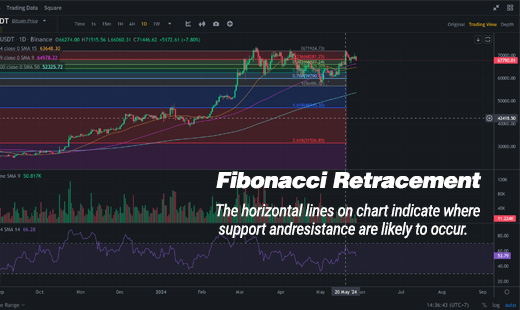 Fibonacci retracement: how to use it? And how to trade Fibonacci Levels?
Fibonacci retracement is a technical analysis tool used in financial markets to identify potential support and resistance levels.
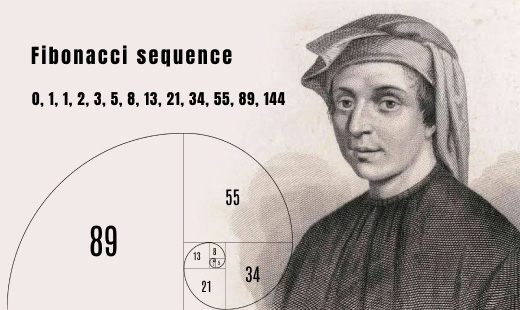 The Fibonacci Sequence discovery and fibonacci in trading
Fibonacci is the name of a Noted Italian Mathematician - Leonardo Pisano Fibonacci. He introduced the Fibonacci Numbers and the Fibonacci Sequence, which is what he remains famous for to this day.
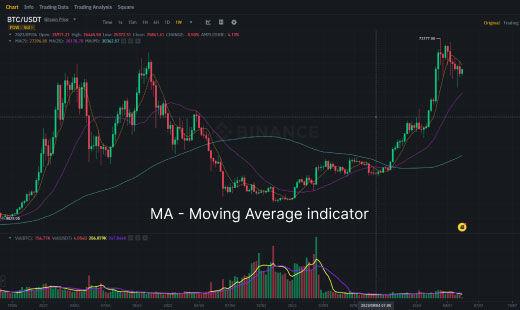 MA - Moving Average Indicator
What is the moving average(MA) indicator? And How to use the best moving average and the best MA indicator setting for your trading.