How to use and trading with Fibonacci Extensions
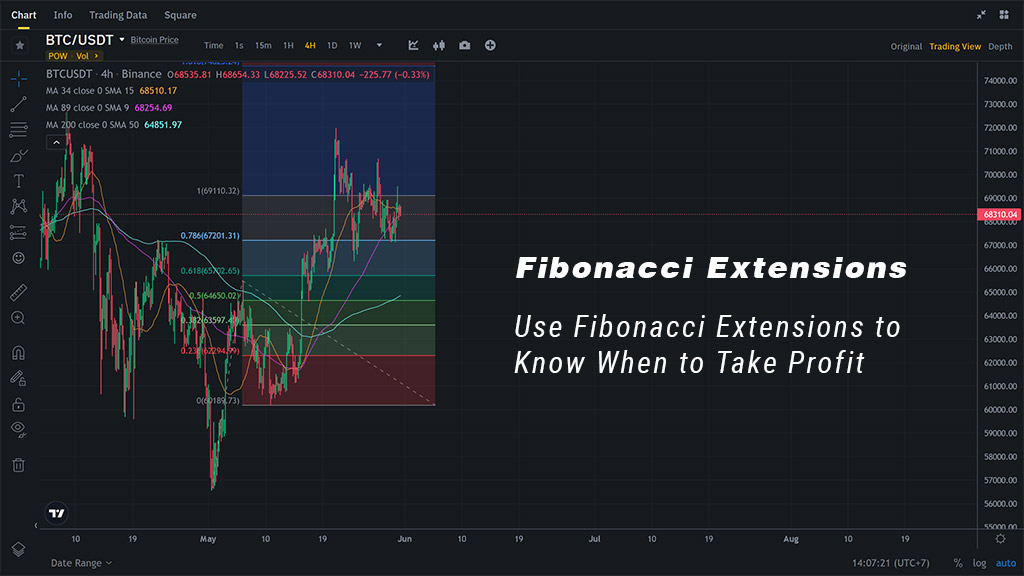
In the previous article we learned about Fibonacci Retracements which are very interesting, now let's learn about Fibonacci Extensions.
What Are Fibonacci Extensions?
Fibonacci extensions are a tool used in technical analysis to identify potential levels of support and resistance in the price movement of an asset. Extension levels are also possible areas where the price may reverse. They are based on the Fibonacci sequence, a series of numbers where each number is the sum of the two preceding ones, often observed in nature and mathematics.
Fibonacci extensions are similar to Fibonacci retracements. It is used to determine possible support and resistance levels.
Like Fibonacci retracements, Fibonacci extensions are based on the mathematical relationships, expressed as ratios, between the numbers in the Fibonacci series.
In the context of trading and investing, Fibonacci extensions involve using key Fibonacci ratios (like 61.8%, 100%, 161.8%, 261.8%, and 423.6%) to project potential price levels beyond the standard 100% retracement level.
Unlike Fibonacci retracements, Fibonacci extensions seek possible support and resistance levels that are more than 100% of the previous price movement.
How Fibonacci extensions work and how traders use them
Fibonacci extensions don't have a formula. Rather, they are drawn at three points on a chart, marking price levels of possible importance.
The Fibonacci extensions show how far the next price wave could move following a pullback.
Based on Fibonacci ratios, common Fibonacci extension levels are 61.8%, 100%, 161.8%, 200%, and 261.8%.
Extension levels signal possible areas of importance, but should not be relied on exclusively.
Identify a trend: Determine the direction of the trend by locating a significant high and low on the price chart.
Apply Fibonacci levels: Use a Fibonacci extension tool (available on most trading platforms) to draw the extension levels by connecting three points:
- The start of the trend (A).
- The end of the trend (B).
- The retracement point (C), which is a significant pullback from the end of the trend.
Project Potential Targets: The Fibonacci extension levels will then project potential price targets in the direction of the trend. These levels are calculated using the differences between points A and B, and then applying the Fibonacci ratios to these differences.
Key Fibonacci Ratios Used in Extensions:
- 61.8%: Derived from the golden ratio, often seen as a key reversal point.
- 100%: Represents a price move equal to the initial trend move.
- 161.8%: Another key level based on the golden ratio.
- 261.8% and 423.6%: Extended levels that represent further potential price targets beyond the 161.8% level.
Example:
Assume an asset moves from $100 (point A) to $150 (point B), and then retraces to $120 (point C). The Fibonacci extension levels would be calculated based on this move:
61.8% extension level: $150 + (0.618 * ($150 - $100)) = $150 + $30.9 = $180.9
100% extension level: $150 + ($150 - $100) = $150 + $50 = $200
161.8% extension level: $150 + (1.618 * ($150 - $100)) = $150 + $80.9 = $230.9
Usage:
Traders use these extension levels to:
- Identify potential take-profit levels.
- Set stop-loss orders.
- Identify areas where the price might face resistance or support.
- Confirm the strength of a trend (if prices move past certain extension levels).
Use Fibonacci Extensions to Know When to Take Profit
Let’s start with an example of an uptrend. In an uptrend, the general idea is to take profits on a long trade at a Fibonacci Price Extension Level.
You determine the Fibonacci extension levels by using three mouse clicks.
- First, click on a significant Swing Low, then drag your cursor and click on the most recent Swing High. Finally, drag your cursor back down and click on any of the retracement levels.
- This will display each of the Price Extension Levels showing both the ratio and corresponding price levels.
- Let’s pop on the Fibonacci extension tool to see where would have been a good place to take off some profits.
- The 61.8%, 100%, and 161.8% levels all would have been good places to take off some profits.
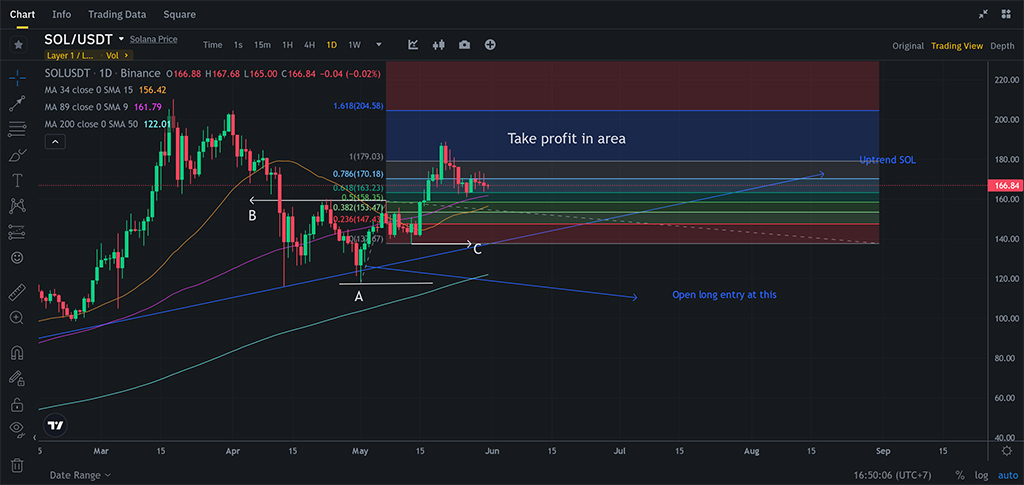 Use the Fibonacci extension to take profit in the Solana's D1 chart example
By integrating Fibonacci extensions with other technical analysis tools, such as trendlines, moving averages, or other indicators, traders can enhance their ability to predict future price movements and make more informed trading decisions.

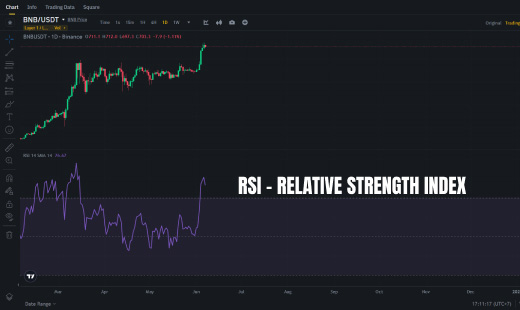 Relative Strength Index RSI. What is RSI? How to use and how to trade with RSI?
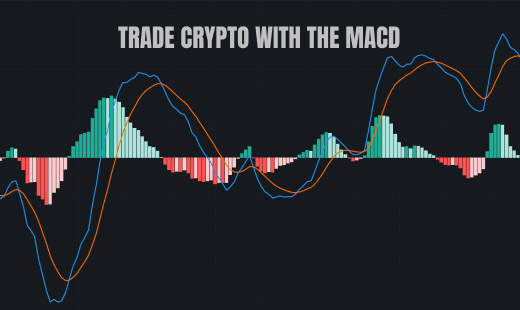 What is MACD Moving Average Convergence Divergence and how to use?
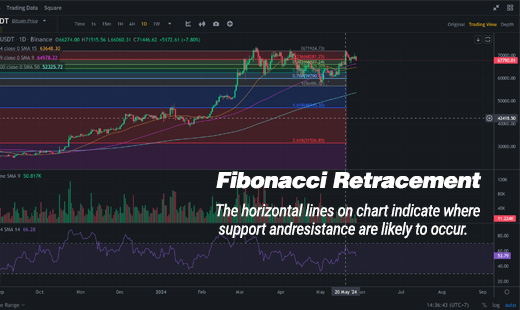 Fibonacci retracement: how to use it? And how to trade Fibonacci Levels?
 The Fibonacci Sequence discovery and fibonacci in trading
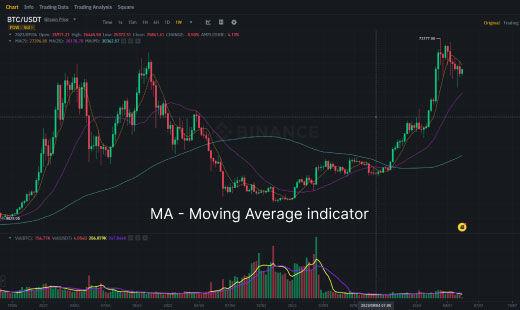 MA - Moving Average Indicator

