Candlestick patterns for trader
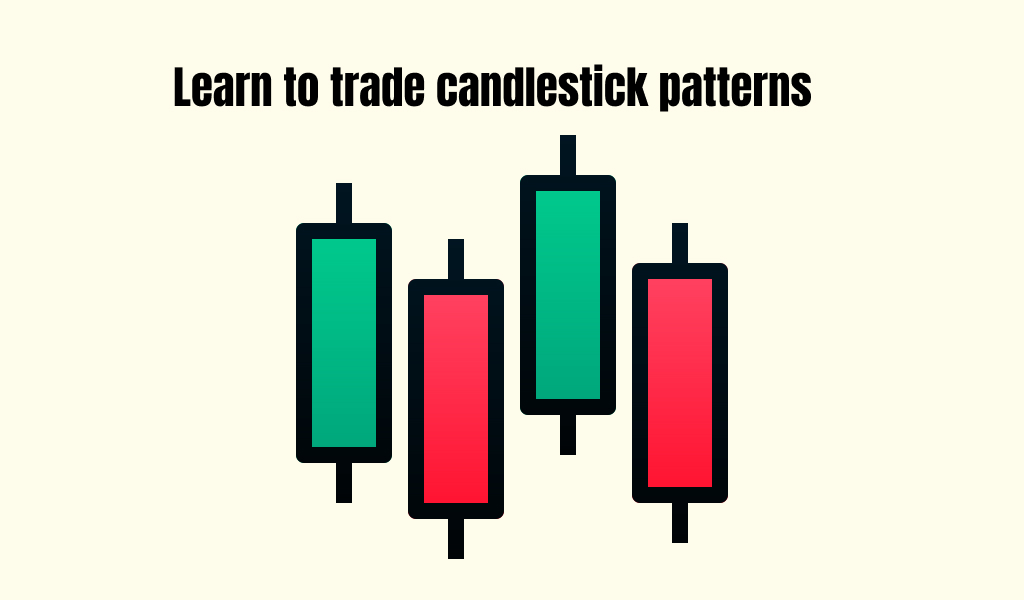
A candlestick chart also called Japanese candlestick chart is a style of financial chart used to describe price movements of a security, derivative, or currency.
What are candlestick chart patterns?
In financial technical analysis, a candlestick pattern is a movement in prices shown graphically on a candlestick chart.
Candlestick charts are a technical tool that packs data for multiple time frames into single price bars. This makes them more useful than traditional open, high, low, and close (OHLC) bars or simple lines that connect the dots of closing prices. Candlesticks build patterns that may predict price direction once completed. Proper color coding adds depth to this colorful technical tool, which dates back to 18th-century Japanese rice traders
Traditionally, candlesticks are best used on a daily basis, the idea being that each candle captures a full day’s worth of news, data, and price action. This suggests that candles are more useful to longer-term or swing traders.
Most importantly, each candle tells a story. When looking at a candle, it’s best viewed as a contest between buyers and sellers. A light candle (green or white are typical default displays) means the buyers have won the day, while a dark candle (red or black) means the sellers have dominated.2 But what happens between the open and the close, and the battle between buyers and sellers, is what makes candlesticks so attractive as a charting tool.
Candlestick history
Japanese candlestick patterns have been around for centuries. Originally they were used by merchants to help them predict and profit from rice trading in the 18th century, Much of the credit for candlestick charting goes to Munehisa Homma (1724–1803), a rice merchant from Sakata, Japan who traded in the Ojima Rice market in Osaka during the Tokugawa Shogunate. You can say that they have really passed the test and are a “seasoned” tool for any financial market and if they were not reliable then they would have faded away many years ago, but today they are more useful than ever.
How to read a candlestick pattern?
Formation of candlestick
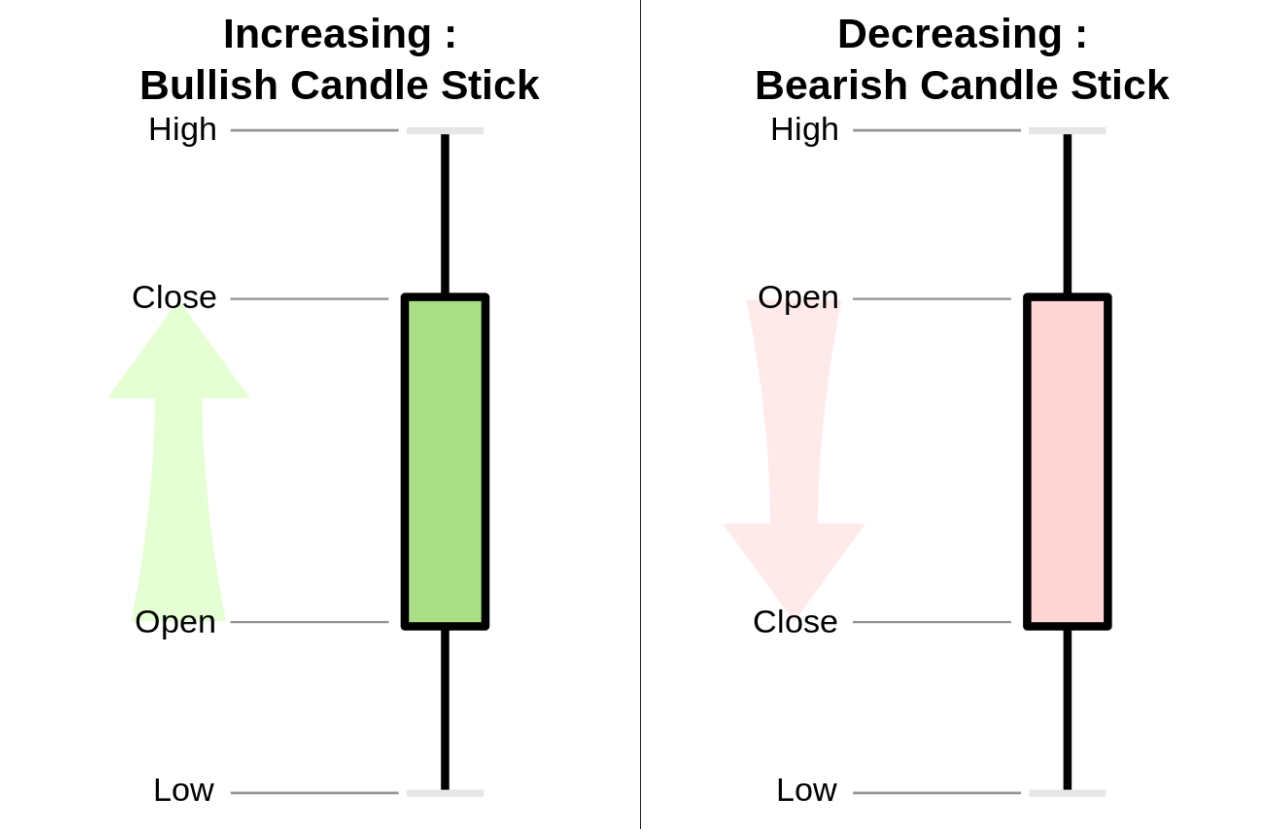
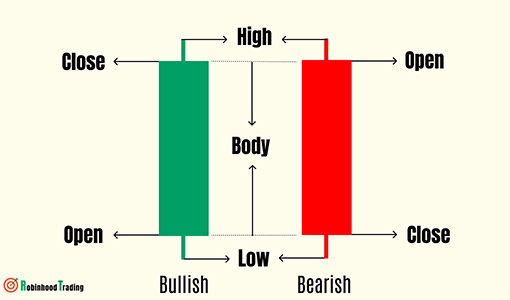
Candlesticks are graphical representations of price movements for a given period of time.
They are commonly formed by the opening, high, low, and closing prices of a financial instrument.
If the closing price is above the opening price, then normally a green or hollow candlestick (white with black outline) is shown.
If the opening price is above the closing price then a filled (normally red or black) candlestick is drawn.
The filled or hollow portion of the candle is known as the body or real body, and can be long, normal, or short depending on its proportion to the lines above or below it.
The lines above and below, known as shadows, tails, or wicks, represent the high and low price ranges within a specified time period.
However, not all candlesticks have shadows.
Read more > simple candlestick patterns

 Simple candlestick patterns
 5 five bearish candlestick patterns
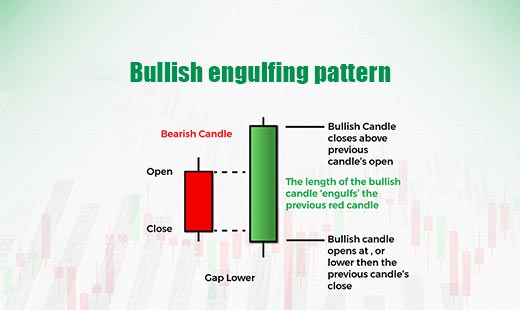 3 three bullish candlestick patterns
