3 three bullish candlestick patterns
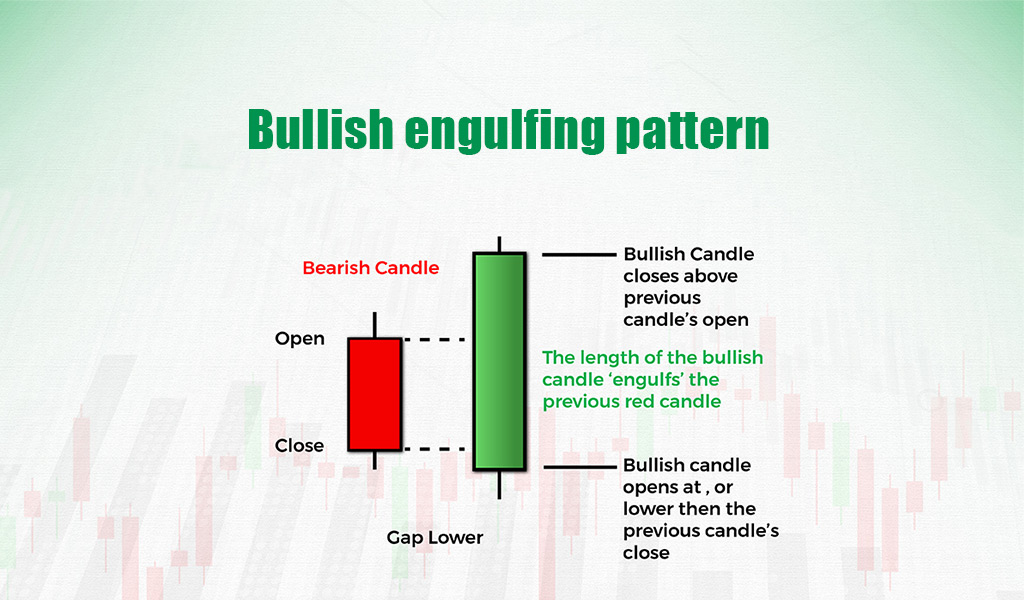
The bullish candlestick patterns often signal potential upward price movements in financial markets.
Candlestick patterns are price action patterns that can be used to forecast price movement. Their uniqueness lies in the ease with which they can be learned and integrated into multiple trading strategies.
The most reliable Japanese Candlestick chart patterns - three bullish and five bearish candlestick patterns - are rated as STRONG. Strong candlestick patterns are at least 3 times as likely to resolve in the indicated direction (greater than or equal to 75% probability).
You will learn the 3 bullish candlestick patterns that can be easy to used in stock trading. Let’s begin.
Bullish Engulfing Pattern
The bullish engulfing candlestick pattern is a two-candle reversal pattern. The second candle completely 'engulfs' the real body of the first one, without regard to the length of the tail shadows. This pattern appears in a downtrend and is a combination of one dark candle followed by a larger hollow candle.
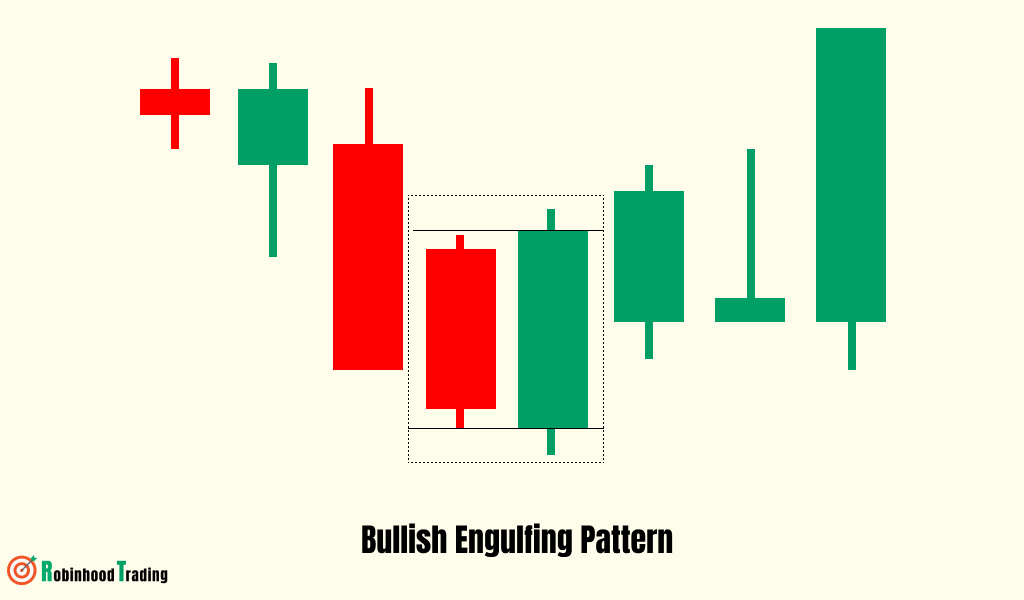
Bullish engulfing candlestick pattern
The bullish engulfing is a significant price action signal when it occurs at key levels in the stock market. These key levels include support levels, demand zones, trend lines, etc.
For a bullish engulfing to be valid, it should have a high volume indicated by the volume bars, and its body should completely engulf that of the previous candle. This is important to note while trading this price action signal.
The psychology behind the formation of this pattern is the fact that buyers come in at key levels. As such, the volume of their trades increases the buying pressure and causes the bullish candle to engulf the previous candle; as a sign of strength or significant buying pressure.
Bullish morning star candlestick pattern
The morning star is a 3-candle pattern that can be used to forecast bullish reversals with a significant degree of accuracy.
As it is formed at the end of a downtrend, it gives us a warning sign that the downtrend is going to reverse to an uptrend.
It consists of three candles;
The first candlestick is usually bearish with a medium-sized or large candle body. This shows the presence of sellers in the market.
The second candle is small-sized, preferably one with a small body. This shows the reduction in selling pressure as buyers come into the market.
The third candle is a bullish candle, preferably one with a large body that engulfs the preceding small candlestick.
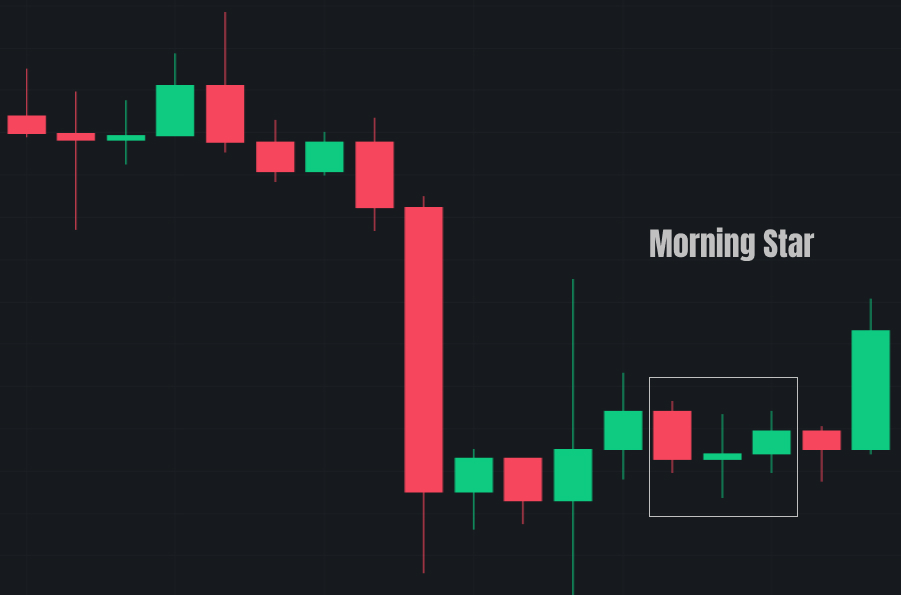
One should remember when trading with the Morning Star pattern the prior trend should be a downtrend.
Hammer & Inverted Hammer
The hammer and inverted hammer are unique candlestick patterns that appear to be opposites but actually show a bullish reversal.
The hammer, as the name suggests, is shaped like a hammer. The lower part of this candle is a wick of considerable length, while the upper part is the candle body. In other words, the candlestick has a long wick and a small upper body.
The inverted hammer is like an inverted version of the hammer. It is a candlestick with a long upper wick and a small lower body.
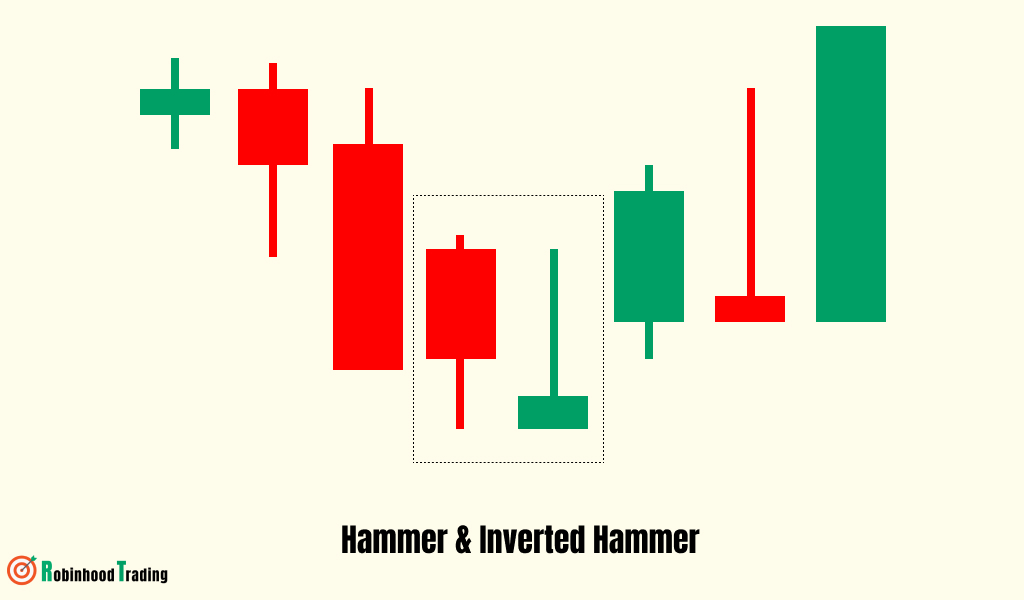
Hammer is a bullish reversal candlestick pattern that occurs at the bottom of a downtrend.
This bullish candlestick pattern is formed when the open and low prices are almost the same. This pattern should consist of a lower shadow which is twice as long as the real body.
When identifying this pattern, we should remember that the prior trend is a downtrend.
This pattern is formed when the real body is small along with a long lower shadow which shows that bears were trying to push down the prices but they were unable to do so.
A bullish candlestick should be formed after the Hammer, which confirms that the bullish reversal has taken place.

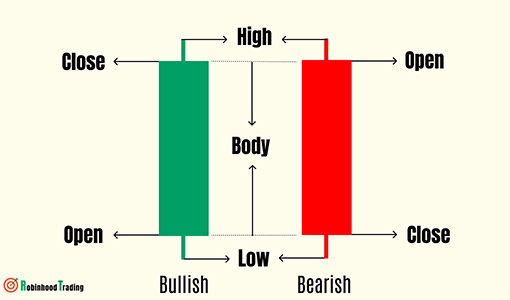 Simple candlestick patterns
 5 five bearish candlestick patterns
 Candlestick patterns for trader
